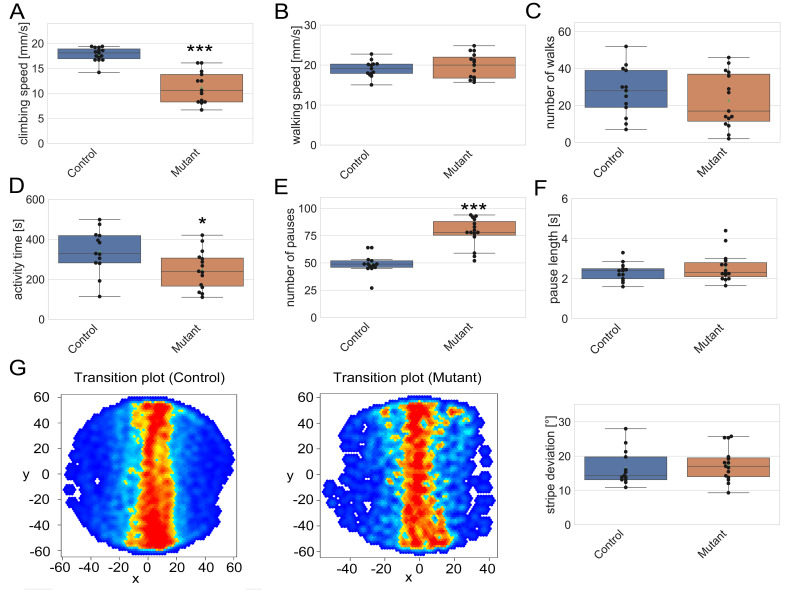
Figure 1. Loss of fuss results in reduced locomotor activity.
(A) Climbing speed of homozygous fuss mutant flies is reduced in contrast to control flies (mean speed (Mutant): 11.2 mm/s; mean speed (Control): 17.8 mm/s; Student’s t-test: p < 0.001). (B) In a Buridan’s assay, walking speed during active times is similar between genotypes (mean speed (Mutant): 19.7 mm/s, mean speed (Control): 19.1 mm/s). (C) Number of walks between stripes is slightly but insignificantly reduced in fuss mutant flies compared to controls (mean number of walks (Mutant): 22.7; mean number of walks (Control): 27.4). (D) Activity time is significantly reduced in fuss mutant flies compared to controls (mean activity time (Mutant): 248.1 s; mean activity time (Control): 340.3 s; Student’s t-test: p < 0.05). (E) Number of pauses is strongly increased in fuss mutant flies (mean number of pauses (Mutant): 78.0; mean number of pauses (Control): 49.1; Student’s t-test: p < 0.001). (F) Pause length is similar between fuss mutant flies and controls (mean pause length (Mutant): 2.6s; mean pause length (Control): 2.3s). (G) Stripe perception of fuss mutant flies is similar to control flies as shown by transition plots and stripe deviation (mean stripe deviation (Mutant): 17.6°; mean stripe deviation (Control): 16.6°). n = 13 – 15 for each genotype.

