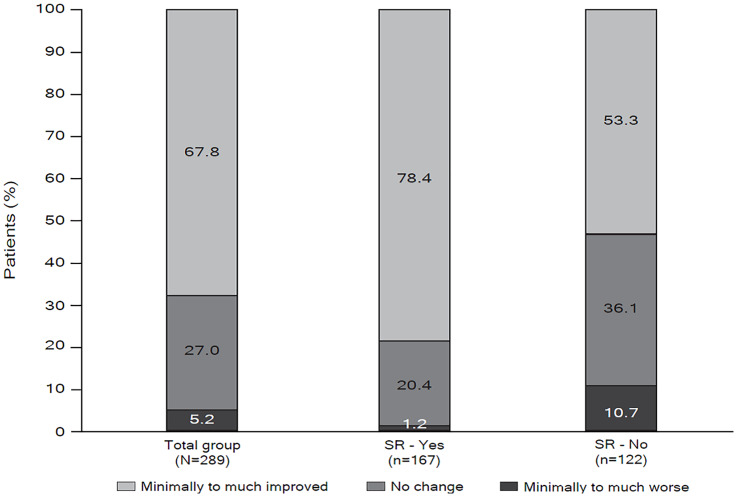
Figure 6.
Distribution of CGI-C score categories at LOCF endpoint for total population and subgroups with or without LOCF endpoint SR (mITT population efficacy analysis set).
CGI-C ranges from 1 = very much improved to 7 = very much worse
CGI-S, clinical global impression of change; LOCF, last observation carried forward; mITT, modified intent-to-treat; SR, symptomatic remission.

