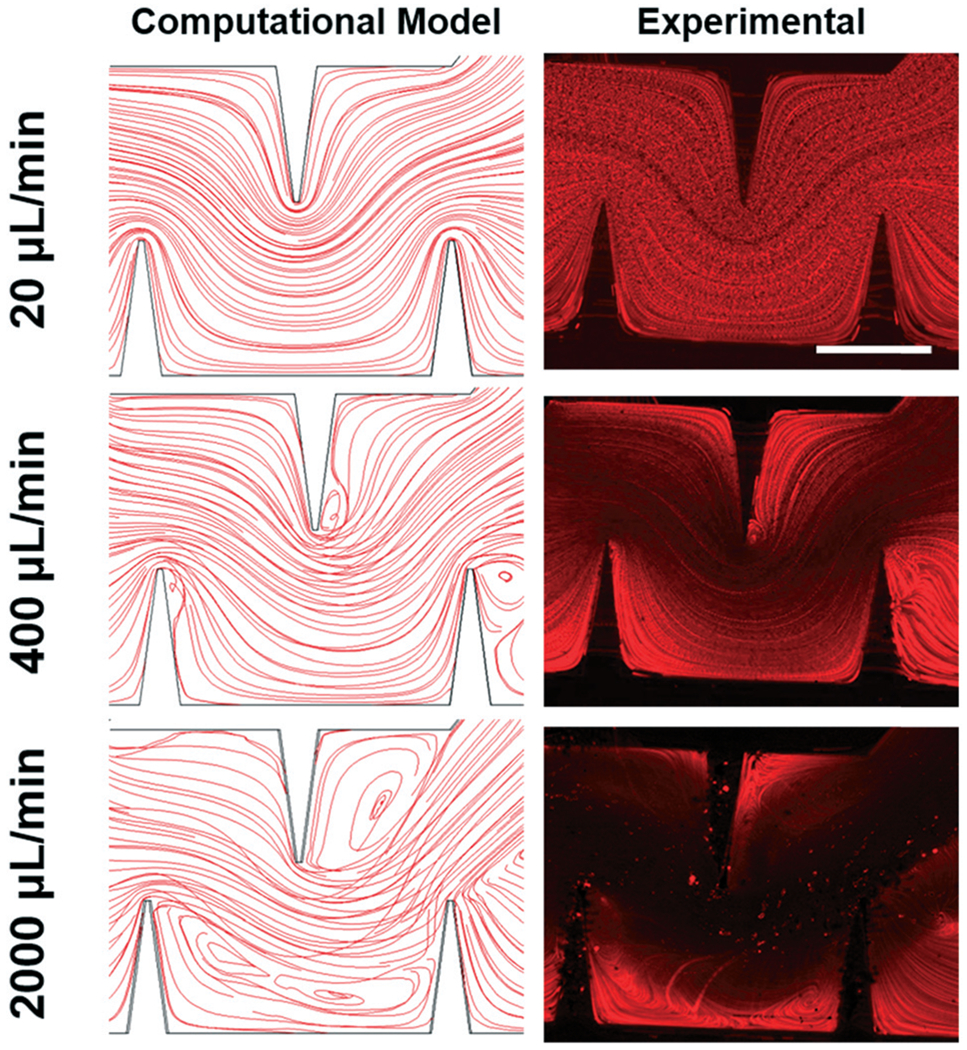
Fig. 3.

Simulated and experimental streaming patterns through the sharp-edge region. Both simulation and experimental results show uniform, laminar streamlines that follow the curve of the sharp-edges at the low (e.g., 20 μL min−1) flow rate, flow separation at the 400 μL min−1 flow rate condition, and larger vortexes produced at 2000 μL min−1. Scale bar: 250 μm.
