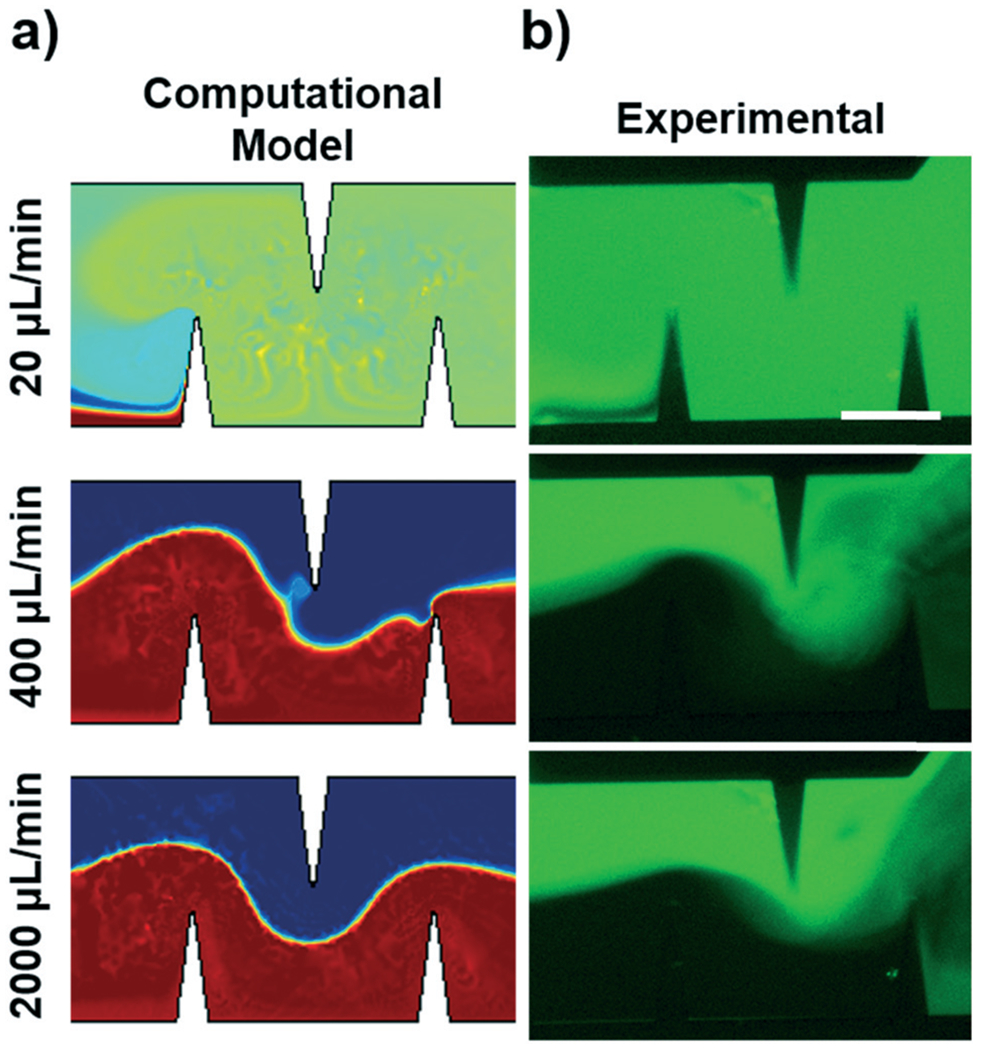
Fig. 4.

a) Simulated mixing performance in the acoustofluidic device across varied flow rates. The background flow (zero order) for each flow rate for each simulation was relatively unchanged except for the magnitude of the fluid velocity, so as to probe the acoustic mixing potential. b) Experimental mixing performance in the acoustofluidic device across various flow rates. A good comparison between the simulated and experimental data is seen for each flow rate. Further mixing can be seen as the fluid leaves the sharp-edge region due to hydrodynamic effects (right sides of the photos), but due to numerical complexity this hydrodynamic effect was not modelled in the COMSOL simulation. Scale bar: 250 μm.
