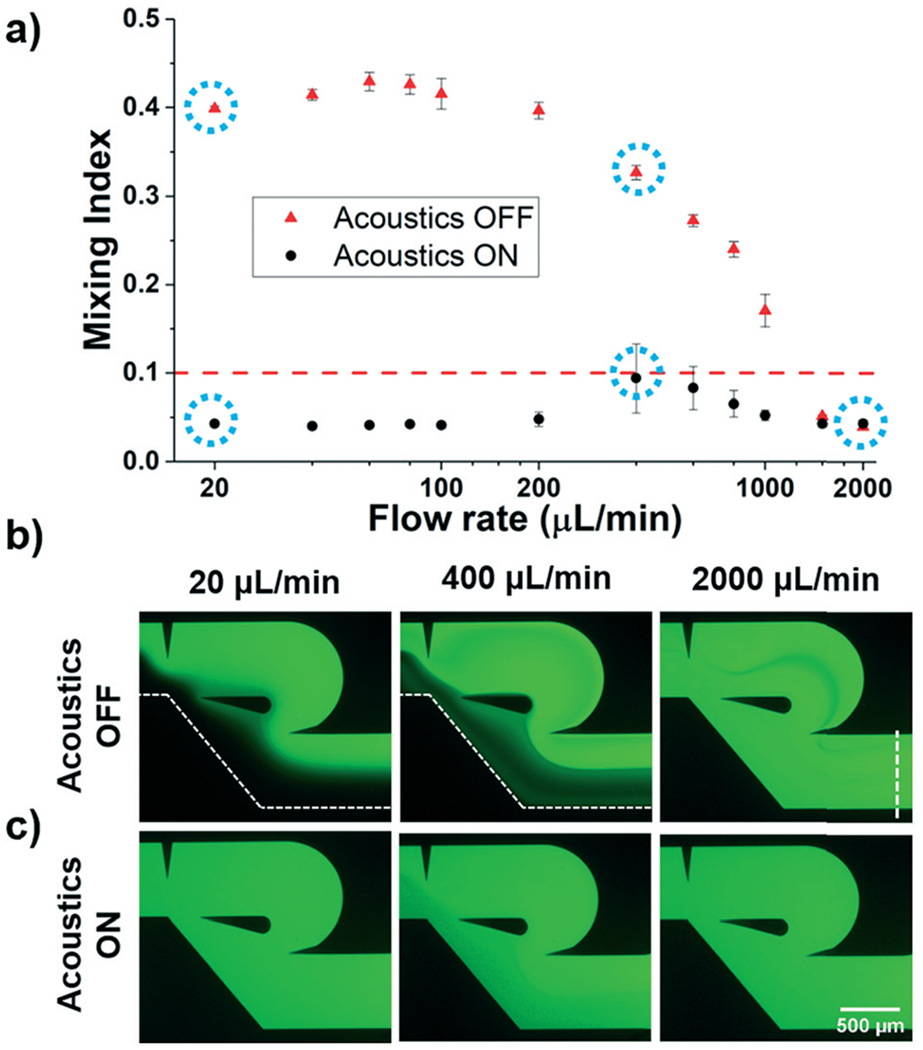
Fig. 5.

a) Plot showing the experimental performance of the acoustofluidic mixing device across a range of flow rates (20–2000 μL min−1). Mixing performance is characterized using the mixing index, where 0.1 or lower indicated complete mixing (dashed red line). With the acoustic signal ON, uniform mixing was achieved across the entire flow rate range tested (n = 3). Blue dashed circles correspond to the fluorescent photos taken at the outlet of the device at various flow rates with the acoustic signal (b) OFF and (c) ON, respectively. The dashed line in the right photo of (b) indicates the line used to evaluate the mixing index shown in (a).
