
Figure 2. Characterization of ICG-GS-Au25 nanoprobes.
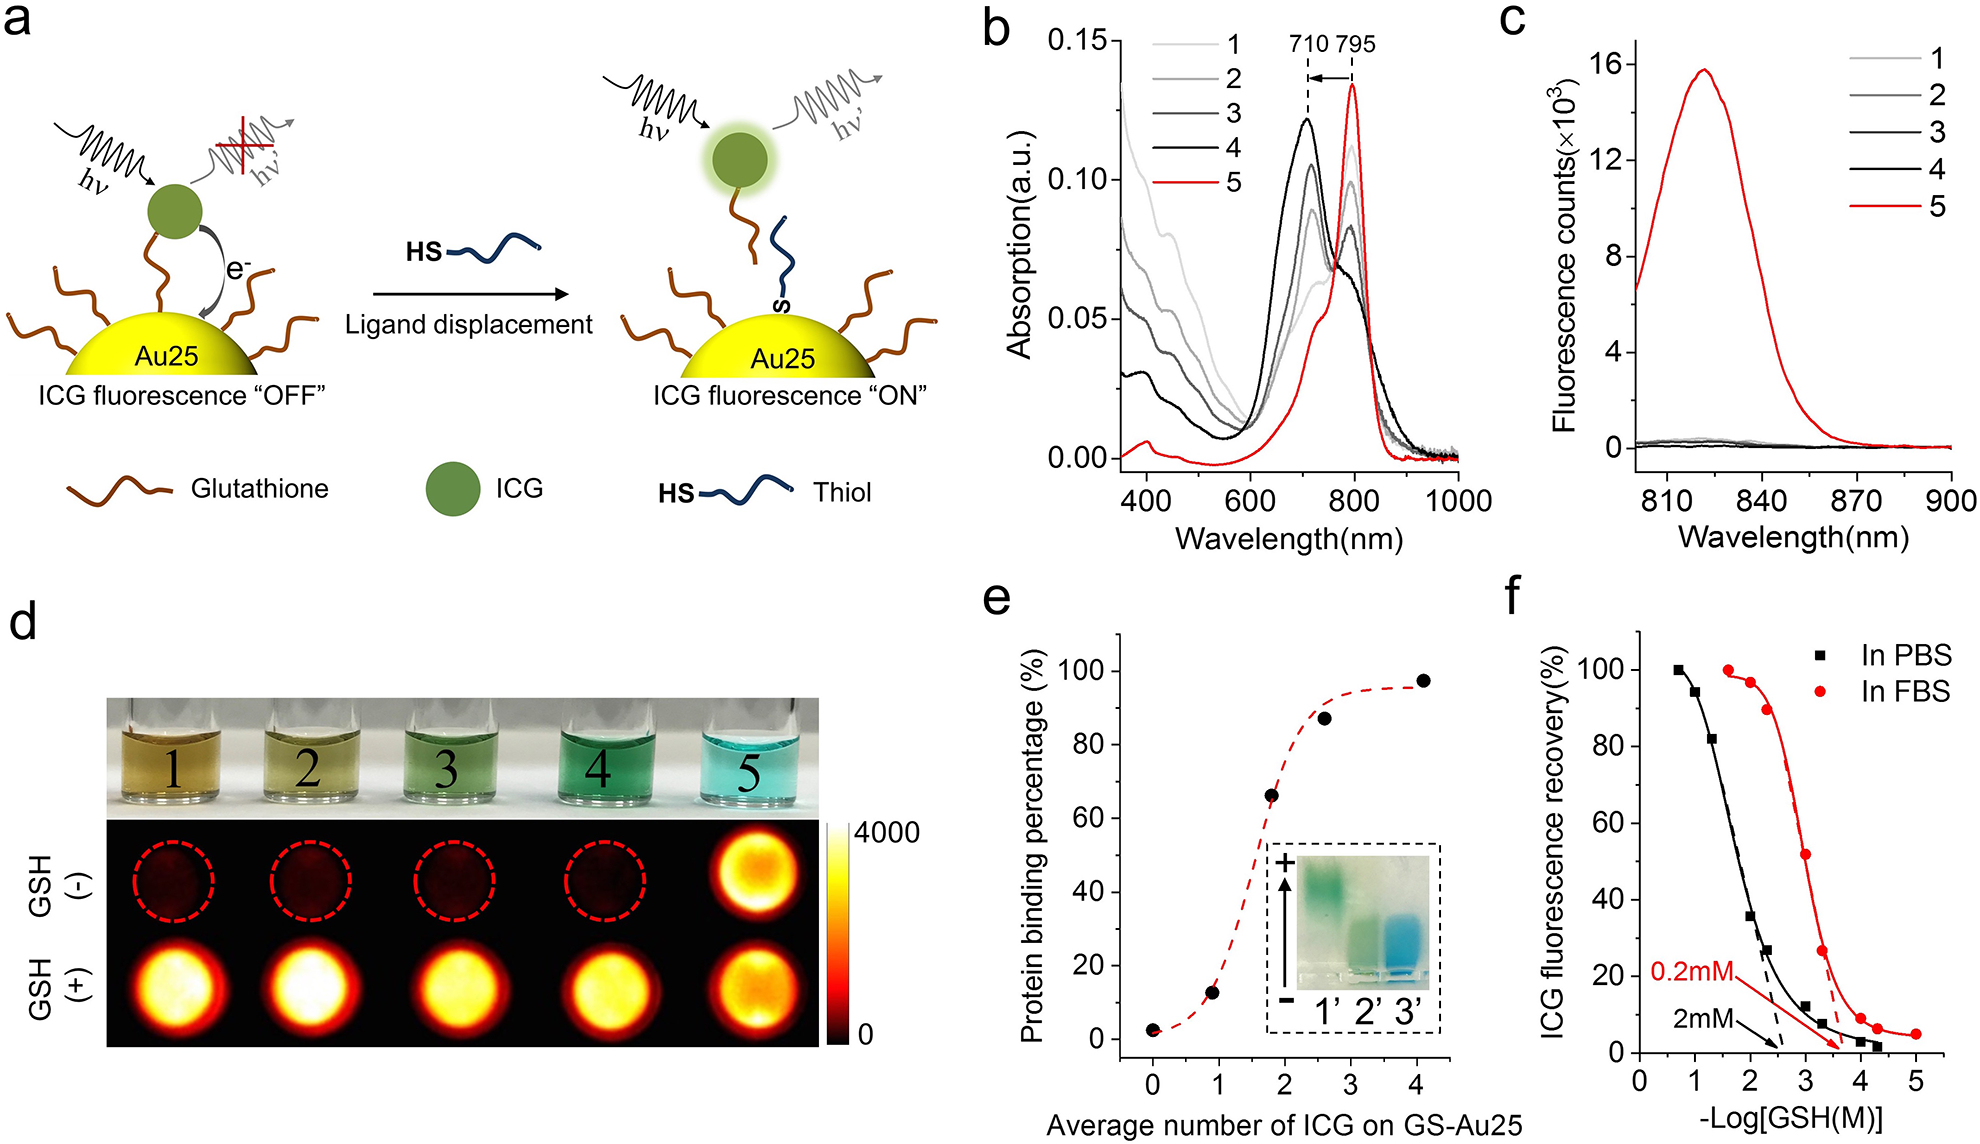
a, Schematic of thiol-activatable ICG-GS-Au25 nanoprobe: when ICG is conjugated onto glutathione ligands on Au25, the NIR fluorescence of ICG is severely quenched due to photoinduced electron transfer; once the ICG-GS ligand is displaced by biothiol molecules and detached from the Au25 surface, the electron transfer process is disrupted and NIR fluorescence of ICG is recovered concurrently. b, Absorption profiles of GS-Au25 conjugated with an average number of 0.9 (1), 1.8 (2), 2.6 (3), 4.1 (4) ICG molecules and free ICG (5). c, Fluorescence spectra of species 1–5 in PBS with the same amount of ICG (excited at 760nm), indicating that GS-Au25 can efficiently quench the fluorescence of ICG regardless of the number of ICG on each Au25. d, Color picture of species 1–5 dissolved in PBS (top) and the corresponding ICG fluorescence signals (middle) taken with an in vivo imaging system. The bottom shows fluorescence signals of the same amount of species 1–5 dissolved in PBS containing 10mM GSH (pH adjusted to 7.4). e, serum protein binding percentage of GS-Au25 and GS-Au25 conjugated with an average number of 0.9, 1.8, 2.6 and 4.1 ICG molecules after 15 min incubation in 50% FBS at 37°C. Protein bound and non-bound portions were separated by gel electrophoresis and quantified by ICP-MS. Inset is a color picture showing gel electrophoresis results of GS-Au25 conjugated with an average number of 4.1 ICG molecules (ICG4-GS-Au25), (1’) ICG4-GS-Au25 in PBS, (2’) ICG4-GS-Au25 in 50% FBS, (3’) 50% FBS stained with 1% CBB dye. f, Percentage of ICG fluorescence recovery after incubating ICG4-GS-Au25 in PBS or 50% FBS with different concentrations of GSH (pH adjusted to 7.4) for 10 min at 37°C. The threshold GSH concentration was estimated by finding the x-axis intercept of the tangent line at the maximal first derivative (slope) point of the respective curve. All the measurements were repeated twice with similar results.