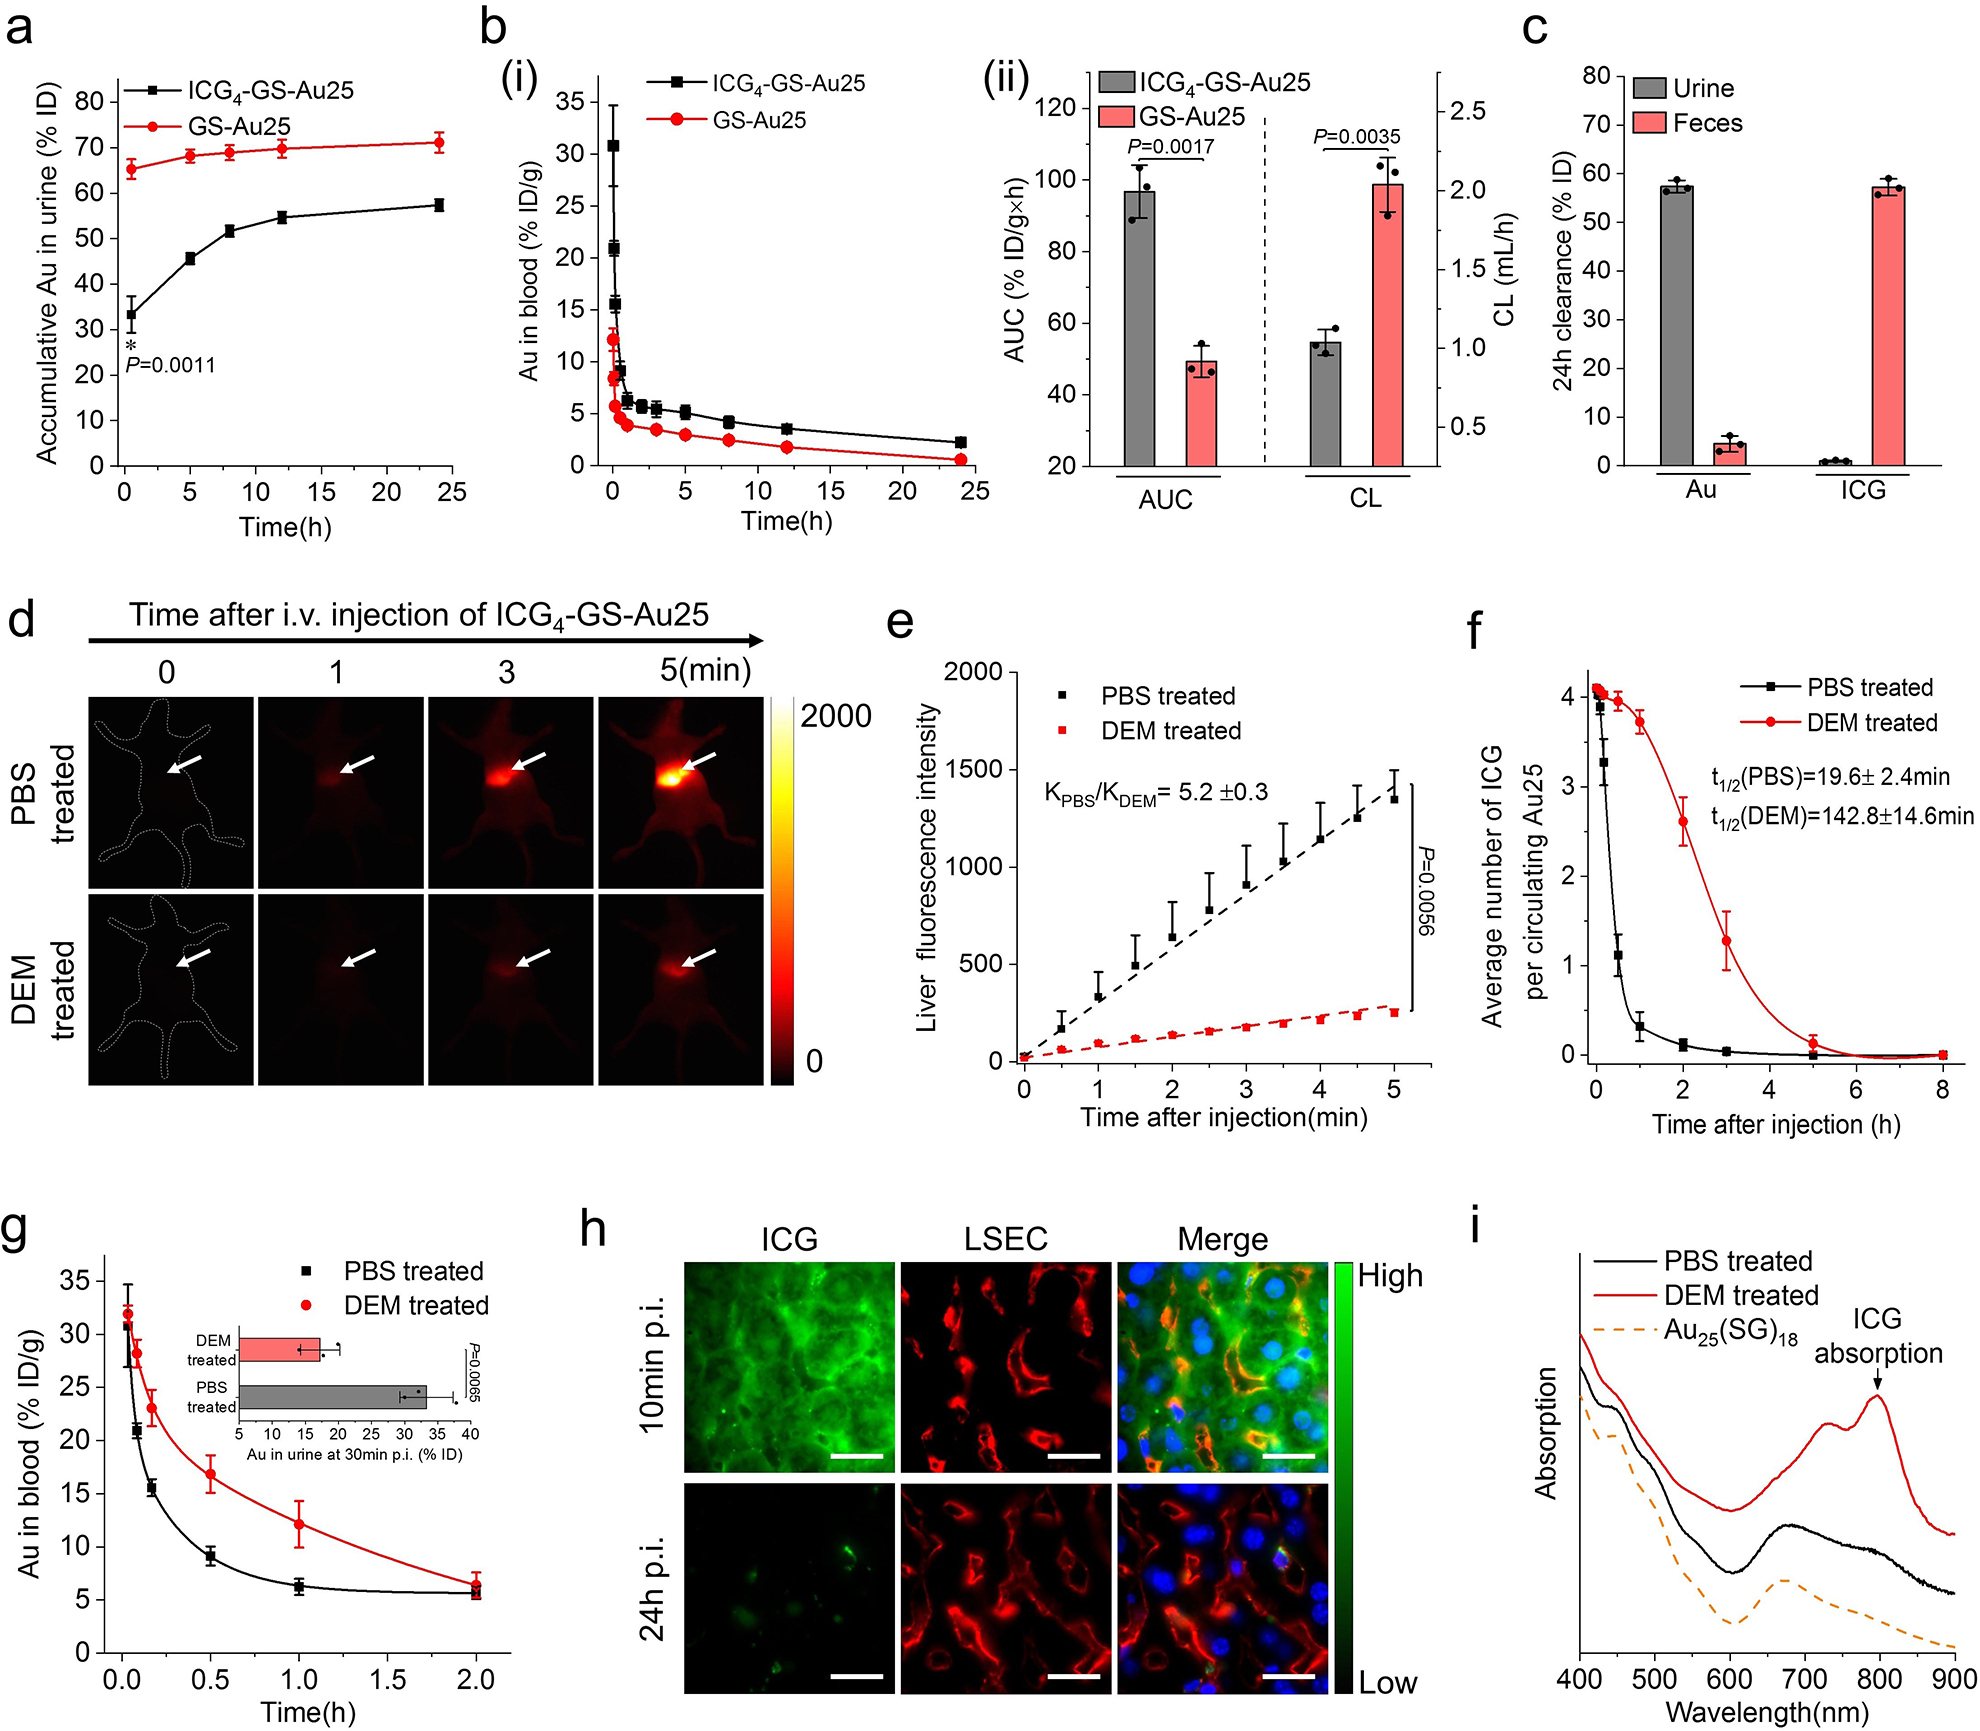
Figure 3. Effect of sinusoidal glutathione efflux on the in vivo behavior of ICG4-GS-Au25.

a, Renal clearance kinetics of GS-Au25 (n=3 mice) and ICG4-GS-Au25 (n=3 mice) after intravenous injection in BALB/c mice. b, (i) Pharmacokinetics of GS-Au25 (n=3 mice) and ICG4-GS-Au25 (n=3 mice) after intravenous injection. (ii) Area under the pharmacokinetics curve (AUC) and clearance parameters of GS-Au25 (n=3 mice) and ICG4-GS-Au25 (n=3 mice) derived from their pharmacokinetics measurements. c, ICG and Au clearance in urine and feces at 24 h after intravenous injection of ICG4-GS-Au25 (n=3 mice). d, Representative time-series noninvasive fluorescence imaging of PBS-treated (control) and DEM-treated mice intravenously injected with ICG4-GS-Au25. The white arrow indicates liver area. e, Liver ICG fluorescence kinetics of PBS-treated (n=3) mice and DEM-treated (n=3) mice in the first 5 min after intravenous injection of the same ICG4-GS-Au25. f, Average number of ICG molecules on each circulating Au25 in PBS-treated (n=3) mice and DEM-treated (n=3) mice after intravenous injection of ICG4-GS-Au25 (see Supplementary Fig. 13 for quantification methods). g, The first 2 h Au pharmacokinetics of PBS-treated (n=3) and DEM-treated (n=3) mice following intravenous injection of the same ICG4-GS-Au25. Inset is the Au renal clearance of PBS-treated (n=3) mice and DEM-treated (n=3) mice at 30min post intravenous injection of ICG4-GS-Au25. h, Fluorescence imaging of liver tissue slides of normal mice at 10 min and 24 h after intravenous injection of ICG4-GS-Au25. Liver sinusoidal endothelial cells (LSECs) were immunostained by anti-CD16/CD32 antibodies (red channel) and cell nuclei were counterstained with DAPI (blue channel). Scale bar, 15μm. i, Absorption profiles of the Au nanoclusters excreted in urine from either PBS-treated (n=3) mice or DEM-treated (n=3) mice intravenously injected with ICG4-GS-Au25. Absorption of Au25(SG)18 is included as a reference. Experiments of figure 3d and 3e were repeated 3 times with similar results. Experiments of figure 3f and 3g were performed once with corresponding controls. Experiments of other figures were repeated twice with similar results. Statistical significance is evaluated using a two-sample unequal variances (Welch’s) t-test. Data points are reported as mean values with error bar denoting the standard deviation.
