
Figure 5. Tumor targeting of ICG4-GS-Au25.
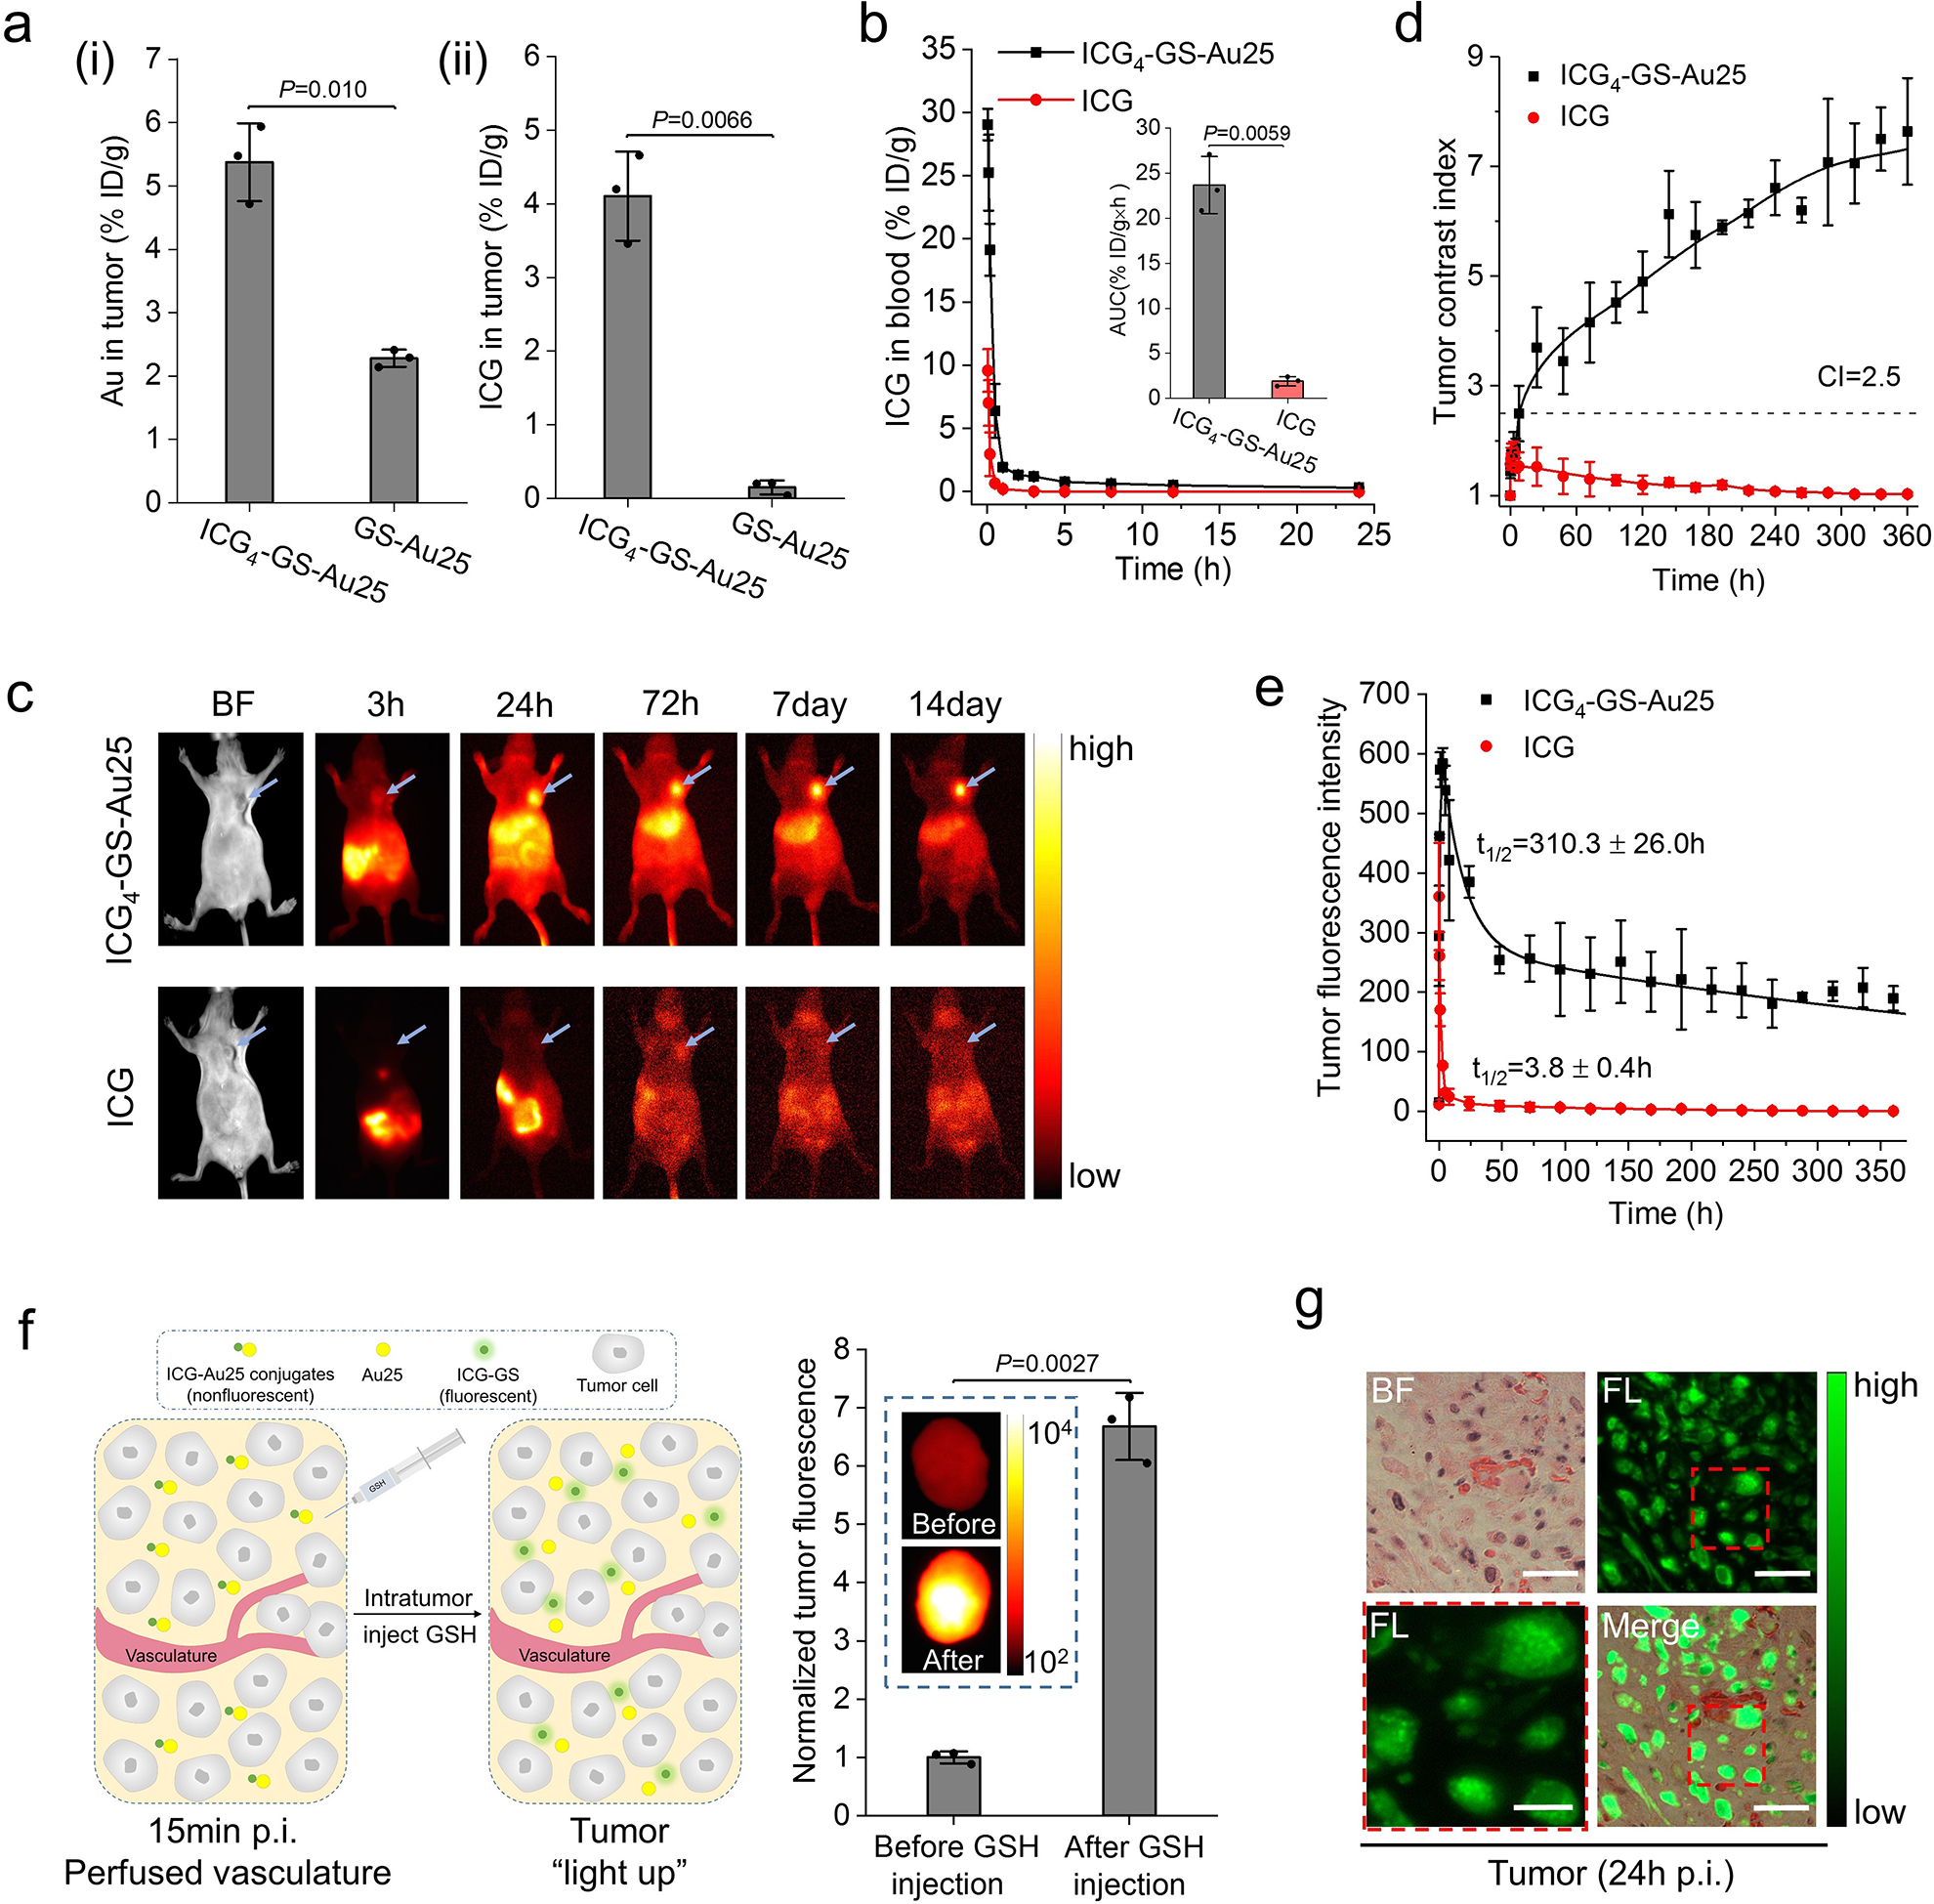
a, MCF-7 tumor targeting efficiency of ICG4-GS-Au25 (n=3 mice) in terms of Au (i) and ICG (ii) at 24 h post injection as compared to those of GS-Au25 (n=3 mice) and free ICG (n=3 mice), respectively. b, Comparison of ICG blood pharmacokinetics between mice intravenously injected with free ICG (n=3 mice) and ICG4-GS-Au25 (n=3 mice). The inserted is the area under the ICG pharmacokinetics curve (AUC) for free ICG and ICG4-GS-Au25. c, Representative in vivo fluorescence images of MCF-7 tumor bearing nude mice at various time points after intravenous injection of either ICG4-GS-Au25 or equal amount of free ICG. Blue arrows indicate the tumors. d, Time-dependent tumor contrast index (CI= mean fluorescence intensity of tumor/ mean fluorescence intensity of contralateral background tissue) after intravenous injection with ICG4-GS-Au25 (n=3 mice) and free ICG (n=3 mice). e, Time-dependent tumor fluorescence intensity for ICG4-GS-Au25 (n=3 mice) and free ICG (n=3 mice). f, On the left is an illustration of the experiment. At 15 min post intravenous injection of ICG4-GS-Au25, the mice were sacrificed and thoroughly perfused with PBS to remove ICG-Au25 conjugates in blood vessels, and then tumors were resected and intratumorally injected with 10mM GSH (pH 7.4) to induce the dissociation of ICG-Au25 in tumor microenvironment. On the right is the tumor ICG fluorescence intensity (normalized) before and after introducing GSH (n=3 tumors). The significantly enhanced ICG fluorescence after GSH injection proves that ICG-Au25 conjugates as a whole effectively entered the tumor microenvironment. Inserted is the fluorescence image of a representative tumor before and after intratumor injection of GSH. g, Fluorescence imaging of H&E stained tumor tissue at 24 h after intravenous injection of ICG4-GS-Au25 (see Supplementary Fig.20 for additional images). ICG was efficiently taken up by the tumor cells and located in endosome-like membrane-bound compartments (see the zoom-in image at lower left), consistent with the observations at the in vitro level (Supplementary Fig.21). Scale bar, 6 μm for the zoom-in image at lower left and 20 μm for the rest. Experiments of figure 5c and 5g were repeated 3 times with similar results. Experiments of other figures were repeated twice with similar results. Statistical significance is evaluated by two-sample unequal variances (Welch’s) t-test. Data points are reported as mean values with error bar denoting the standard deviation.