Figure 3.
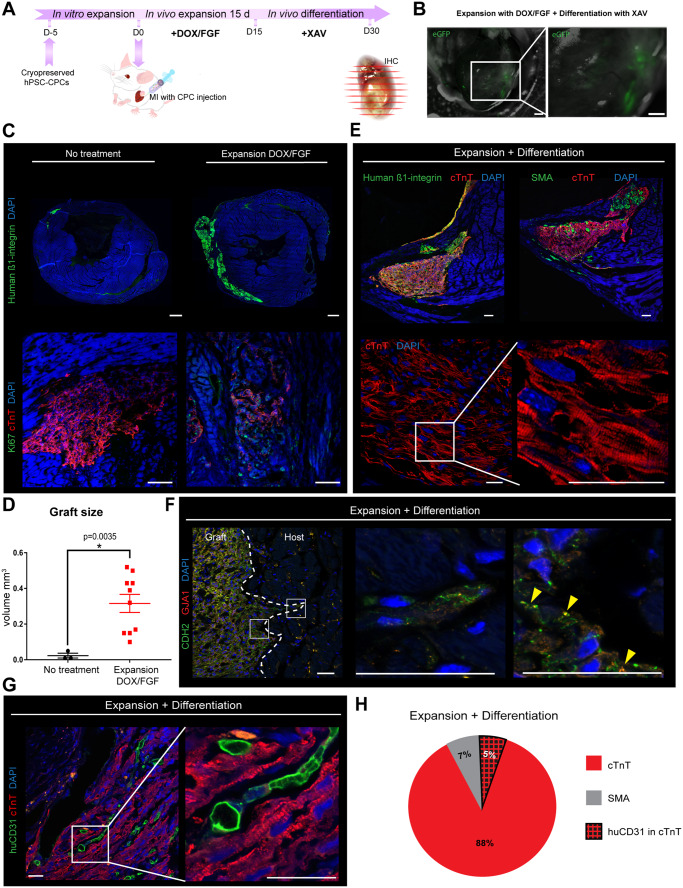
CPCs form large grafts composed of CMs, ECs, and SMCs after intra-myocardial injection post-MI in vivo. (A) Schematic of the experimental workflow for intra-myocardial CPC injection, expansion, and differentiation after MI. (B) Visualization of infarct area by bright field microscopy and intra-myocardial grafts by endogenous GFP (eGFP); infarct area marked in red; scale bar = 500 µm. (C) Representative images of grafts visualized by human β1-integrin staining and DAPI after no treatment and DOX/bFGF treatment, scale bar = 500 µm; Ki-67 expression (green) and cTnT (red) show that DOX/bFGF promotes expansion by proliferation of the CPCs, scale bar = 75 µm. (D) Quantification of graft volume; data are expressed as means ± SEM; one-way ANOVA with Tukey’s multiple comparisons test was applied for differences in means between groups. Statistical significance was defined as P < 0.05; n = 3 for no treatment, n = 10 for DOX/bFGF treatment. (E) Representative confocal immunofluorescent pictures of grafts stained for human β1-integrin (green), cTnT (red), SMA (green), and DAPI (blue); scale bar = 75 µm. High-resolution images of cTnT shows alignment of the sarcomeres in the graft. Scale bar = 25 µm. (F) Representative confocal picture showing the engraftment of the human cells in the mouse heart. Staining for the gap junction proteins GJA1 (connexin 43, red) and N-cadherin (CDH2, green); scale bar = 25 µm. (G) Representative confocal pictures of hearts stained for the human-specific endothelial cell marker CD31 (huCD31, green), cTnT (red), and DAPI (blue); scale bar = 25 µm. (H) Pie chart to illustrate the average cell composition of the grafts after differentiation.

