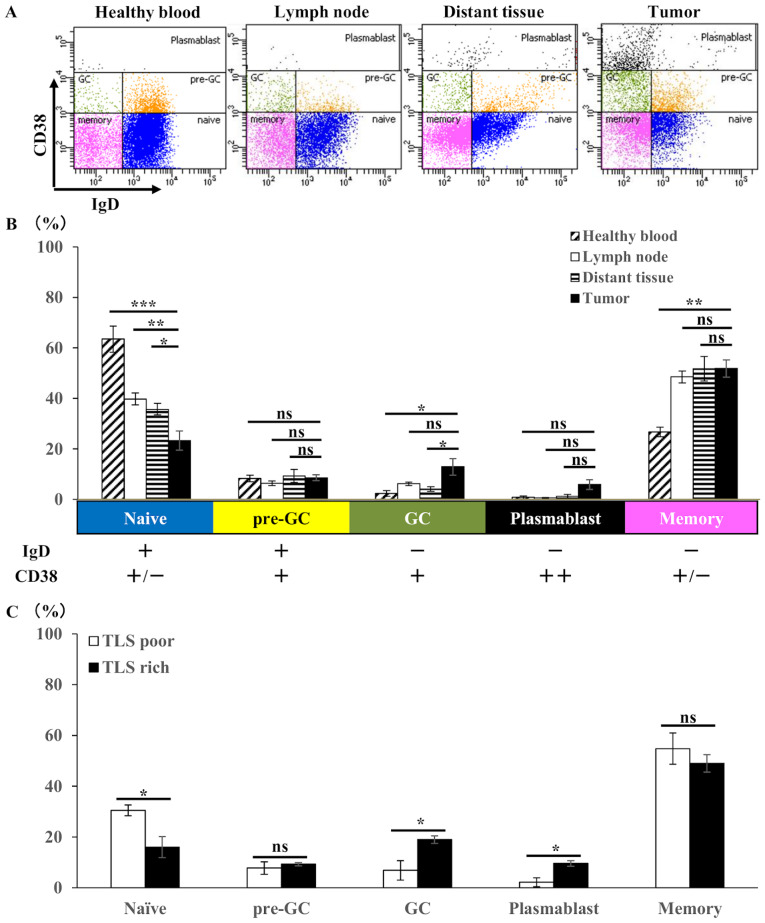
Figure 4.
Flow cytometry analysis of B cell subsets in gastric tumor tissues (n=20), compared with lymph nodes (n=20) and distant nontumoral tissues (n=20) from the same patients with gastric cancer and compared with blood (n=3) from healthy controls. (A) Representative flow cytometry plots and (B) the mean ± SE of the proportion of each B cell subset among the total CD19+ B cells, which were classified using IgD and CD38 as follows: Naïve B cell, CD38(int)/IgD(+); pre-GC B cell, CD38(int)/IgD(+); GC B cell, CD38(int)/IgD(-); plasmablast, CD38(high)/IgD(-); and memory B cell, CD38(-)/IgD(-). (C) Mean ± SE of the proportion of each B cell subset among CD19+ B cells within TLS-rich group (n=10) and TLS-poor group (n=10). *P<0.05. ns, not significant; SE, standard error; Ig, immunoglobulin; +, positive; -, negative; int, intermediate; TLS, tertiary lymphoid structures.

