Figure 9.
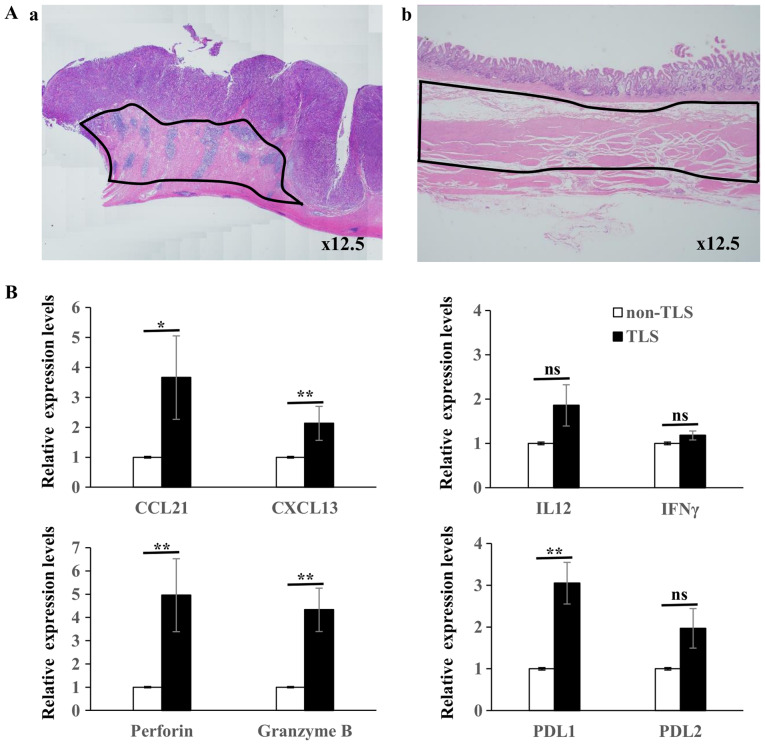
(Aa) Hematoxylin and eosin staining of TLSs area and (b) non-TLSs area within the same specimens; RNA was extracted from inside the black lines. (B) Reverse transcription-quantitative PCR was performed to determine the gene expression level of different genes in TLSs (n=12) vs. non-TLSs (n=12). The results are expressed as arbitrary units (with the expression in non-TLSs defined as 1 unit). The mRNA expression levels of CCL21, CXCL13, perforin, granzyme B, PDL1 was significantly higher in TLSs compared with that in non-TLSs, while the mRNA expression levels of IL12, IFNγ and PDL2 were not statistically significant. *P<0.05. ns, not significant; IL, interleukin, IFN, interferon; TLS, tertiary lymphoid structures.

