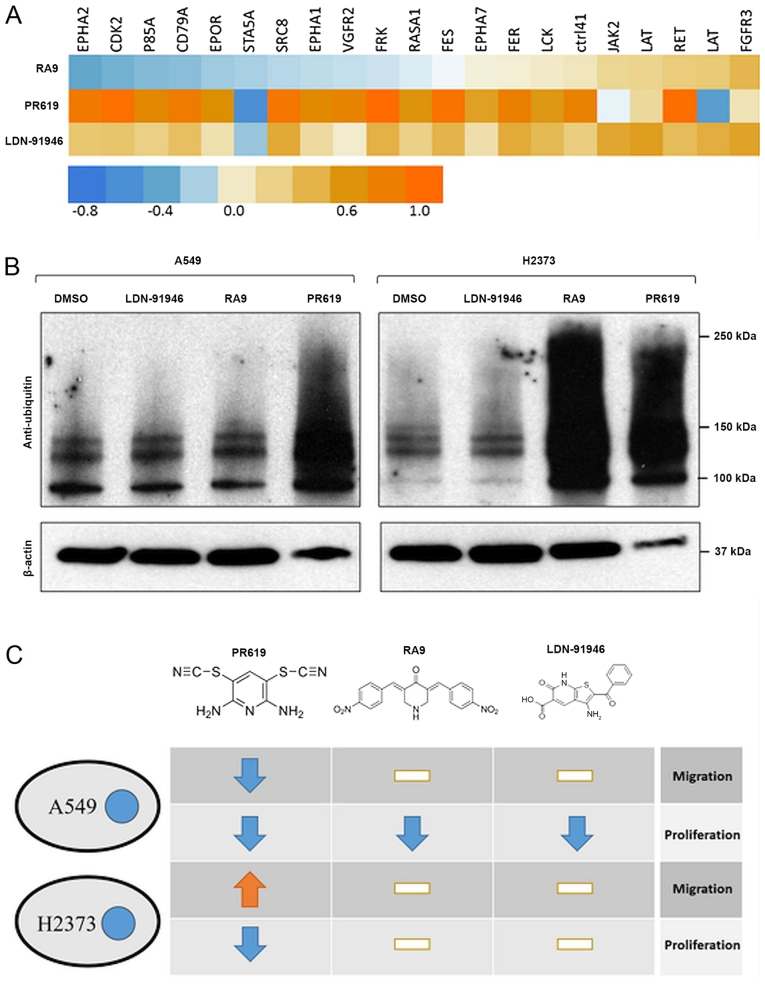
Figure 3.
(A) Heatmap of log-transformed measurements of the extent of phosphorylation in the A549 cell line. The RA-9, PR-619 and LDN-91946 treatment values are subtracted with DMSO values. Note, LAT appears twice (different peptides). (B) Representative western blot of a ubiqutination assay in A549 and H2373 cell lines treated with LD91946 (10 μM), RA9 (5 μM) and PR619 (10 μM). (C) Tabular representation of the drug effects on the studied cell lines as compared with the DMSO control. White bar indicates no significant change.

