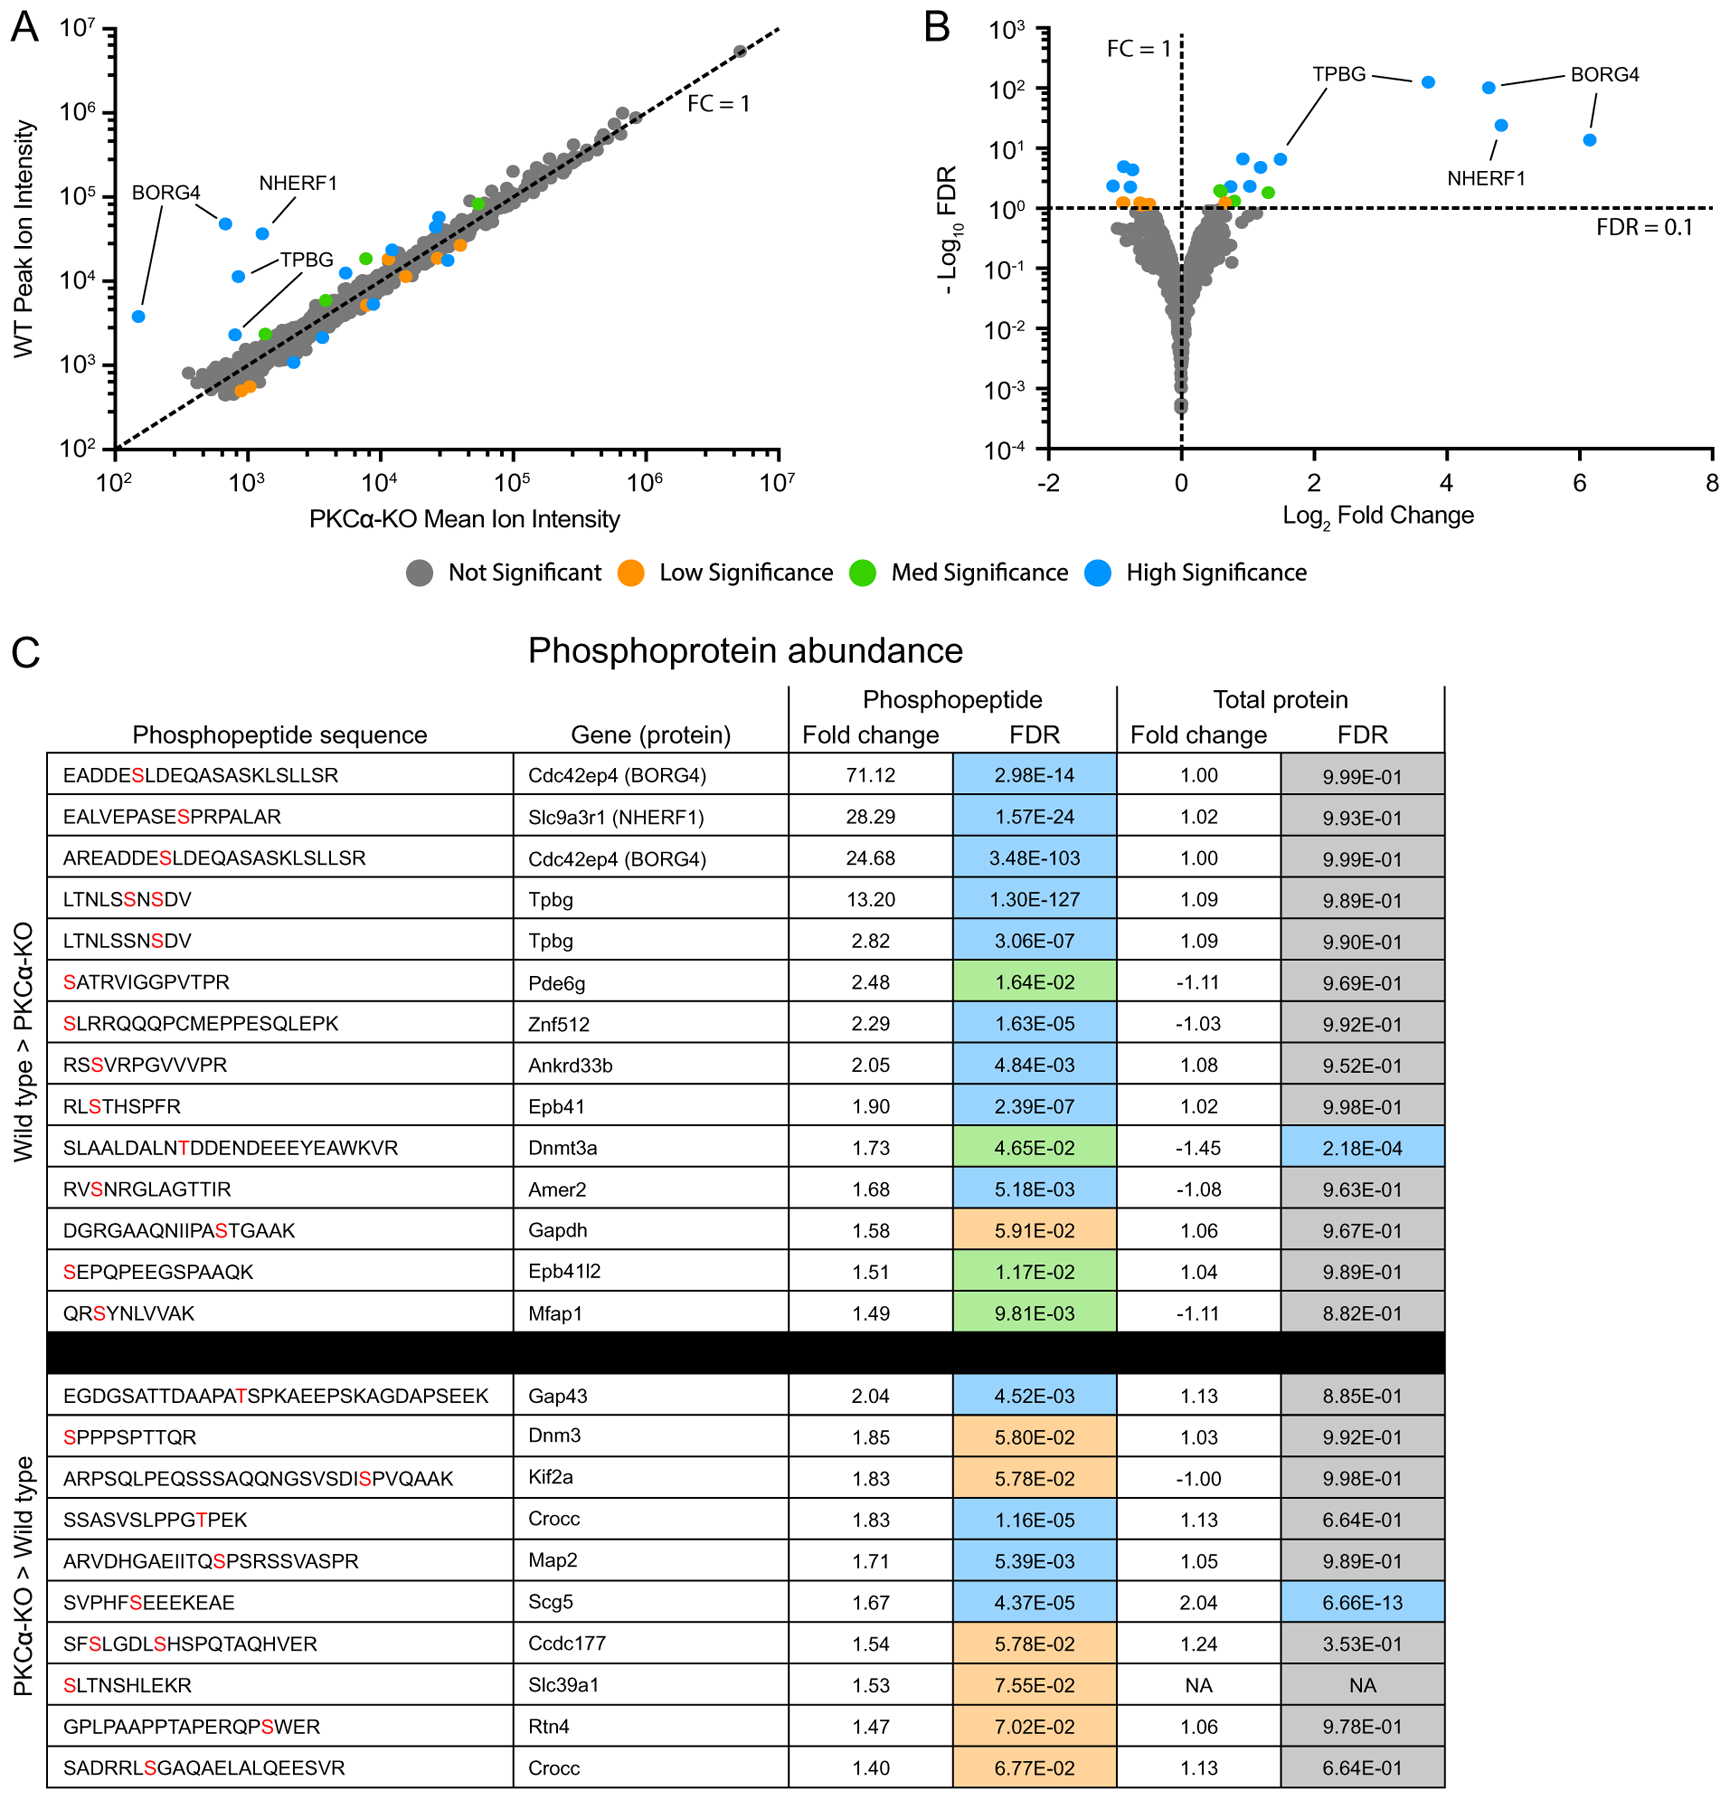
Fig. 6.

Identification of differentially expressed phosphopeptides. (A) Scatter plot of peak reporter ion intensities from wild type (WT) and PKCα knockout (KO) phosphopeptide abundance samples. The dotted line corresponds to an FC (WT / KO) of 1, with FC > 1 corresponding to increased abundance in WT vs KO, and FC < 1 corresponding to increased abundance in KO vs WT. (B) Volcano plot of log2 FC and −log10 FDR. The dotted lines correspond to FC = 1 and FDR = 0.1. FDR < 0.1 corresponds to proteins passing the low significance threshold, and FDR > 0.1 corresponds to proteins failing the low significance threshold. The low significance (orange) threshold was 0.1, the med significance threshold (green) was 0.05, and the high significance threshold (blue) was 0.01. (C) Table of all differentially abundance phosphopeptides with an FDR lower than the low significance threshold of 0.1. In the phosphopeptide sequence column, phosphorylated residues are in red. In the Total Protein Fold Change column, negative values indicate an increased abundance in the KO samples. Fold change was calculated by dividing the mean reporter ion intensities of each protein from the genotype with higher abundance by that with lower abundance. Fold change and DE FDR values were taken from the phosphopeptide abundance experiment and the total protein abundance experiment. Colors correspond to DE FDR thresholds. DE: differential expression; FC: fold change; FDR: false discovery rate.
