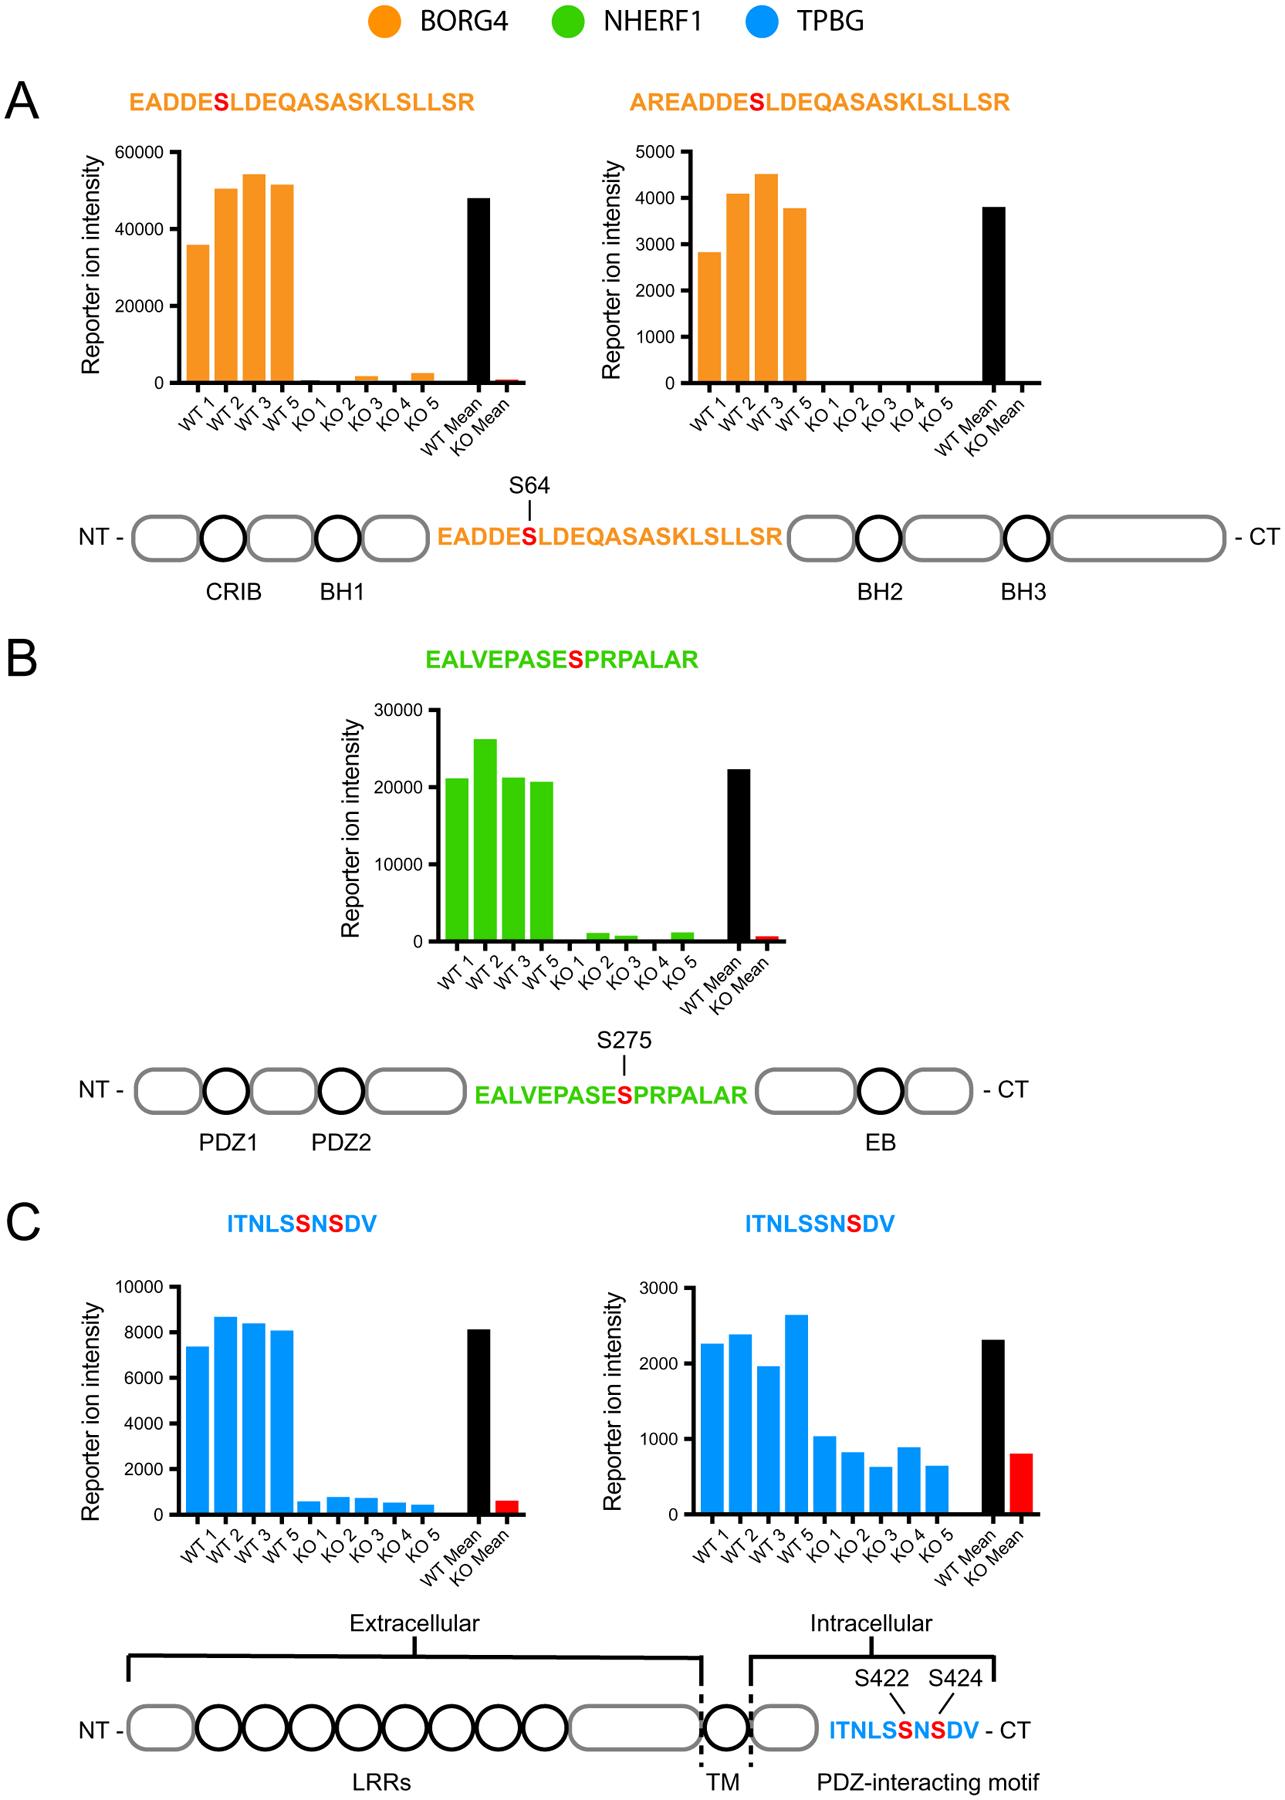
Fig. 7.

TMT data from representative phosphoproteins. Reporter ion intensity values from each TMT channel for the five phosphopeptide fragments with the largest differential expression between WT (n = 4) and PKCα-KO (n = 5): two from BORG4 (orange), one from NHERF1 (green), and two from TPBG (blue). For statistical significance of differential expression analysis of mean WT (black) and mean KO (red) reporter ion intensities, see S1 – Total Protein and Phosphopeptide Abundance Analysis. (A) Two phosphopeptide fragments from an overlapping region of BORG4, each containing a phosphorylated serine corresponding to S64 on the full-length protein. (B) One phosphopeptide fragment from NHERF1 with a phosphorylated serine corresponding to S275 on the full-length protein. (C) Two phosphopeptide fragments from the C-terminal tail of TPBG with two similar phosphorylation patterns: one with two phosphoserines corresponding to S422 and S424, and one with a single phosphoserine corresponding to S424 of the full-length protein.
