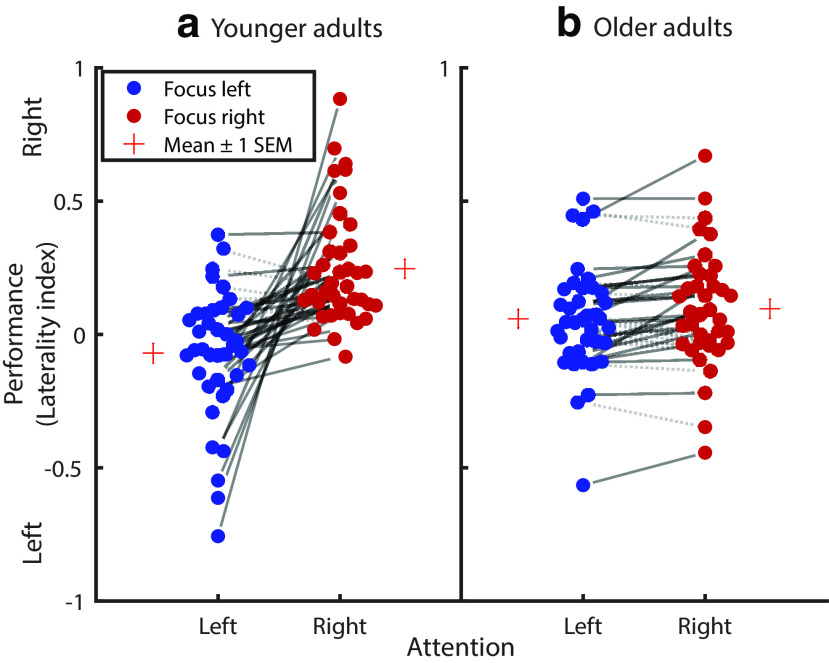
Figure 2.
Selective auditory attention performance of YA (a) and OA (b) in a dichotic listening task. Negative and positive LI values indicate a tendency for left and right ear responses, respectively. Circles connected by solid lines represent participants who demonstrate a behavioral selective attention effect (i.e., more responses of the cued ear relative to the not cued ear), with the slope of the lines reflecting the degrees of attentional modulation. Circles connected by gray dotted lines represent a reversed effect. While the amount of selective attention is markedly decreased in OA, both younger and older participants demonstrate reliable selective attention on a group level. LI = (FR – FL)/(FR + FL)).

