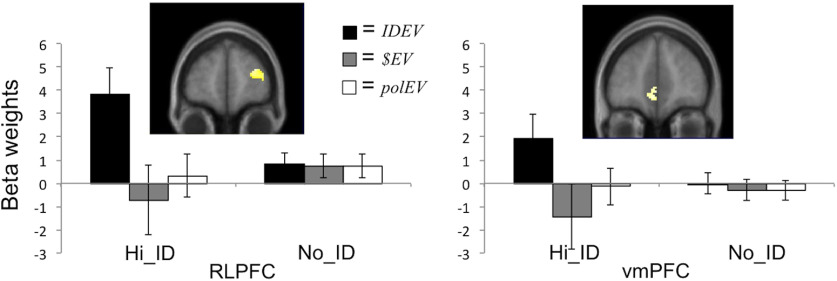
Figure 5.
Neuroimaging results. Map of the t statistics for an interaction test of greater parametric modulation by the difference across rooms in IDEV than $EV, for Hi_ID but not for No_ID choice scenarios, showing effects in the right RLPFC ROI (left) and the vmPFC ROI (right), thresholded at p < 0.01 uncorrected for display purposes. Bar plots represent unbiased β weights extracted from entire ROIs, for differences across rooms in IDEV, $EV and polEV, in Hi_ID and No_ID conditions respectively. Error bars indicate SEM.

