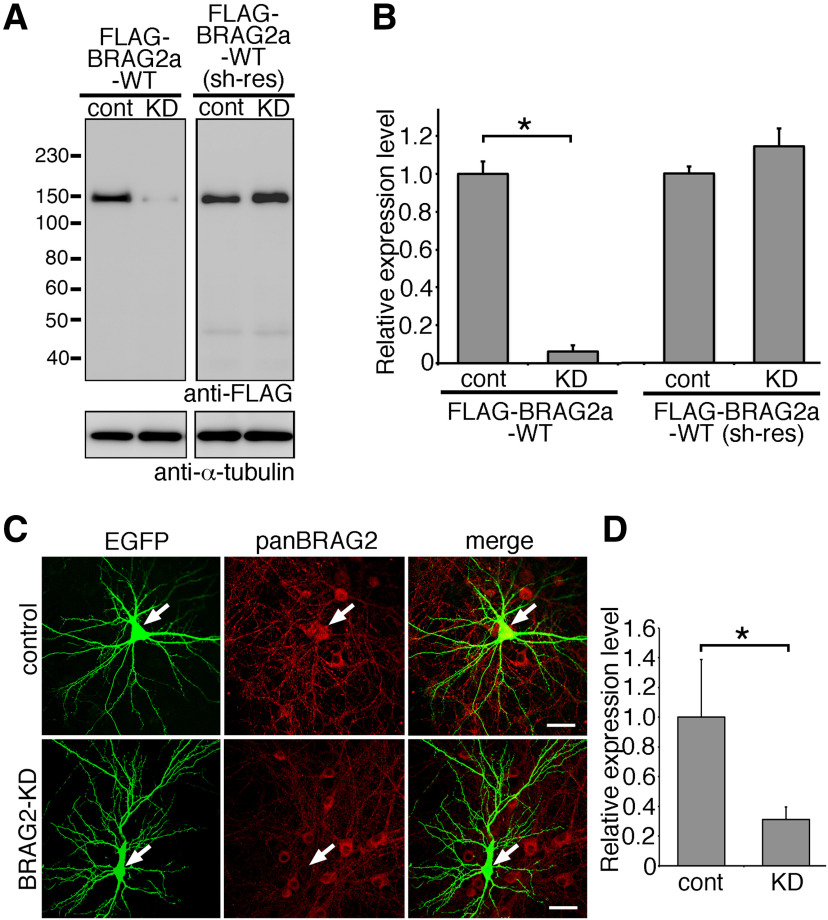
Figure 8.
The efficiency of shRNA for BRAG2. A, B, Verification of BRAG2 knockdown efficiency by immunoblotting. A, HeLa cells were transfected with an shRNA expression vector for BRAG2 (KD) or luciferase [control (cont)] together with FLAG-BRAG2a-WT or shRNA-resistant (sh-res) FLAG-BRAG2a-WT. B, Quantification of the BRAG2 knockdown efficiency. The ratio of the immunoreactivity for FLAG-BRAG2a to that for α-tubulin for each group was normalized and compared with control. *p < 0.05 (t test). Data for each group were obtained from three culture plates (n = 3). These results were confirmed by two independent experiments. C, D, Verification of BRAG2 knockdown efficiency by immunofluorescence in cultured hippocampal neurons. Neurons were transfected with BRAG2-KD or control shRNA at DIV13 and subjected to immunofluorescence with anti-EGFP and anti-panBRAG2 antibodies at DIV15. Note the marked attenuation of immunofluorescence for endogenous BRAG2 in BRAG2-KD-transfected but not control-transfected neurons (C). Arrows indicate shRNA-transfected neurons visualized by simultaneous expression of EGFP. Scale bars, 20 μm. Quantification of the BRAG2 knockdown efficiency in transfected neurons (D). The immunoreactive intensity of BRAG2 was normalized and compared with control. *p < 0.05 (t test). Data for each group were obtained from 20 neurons from three plates. These results were confirmed by three independent experiments.

