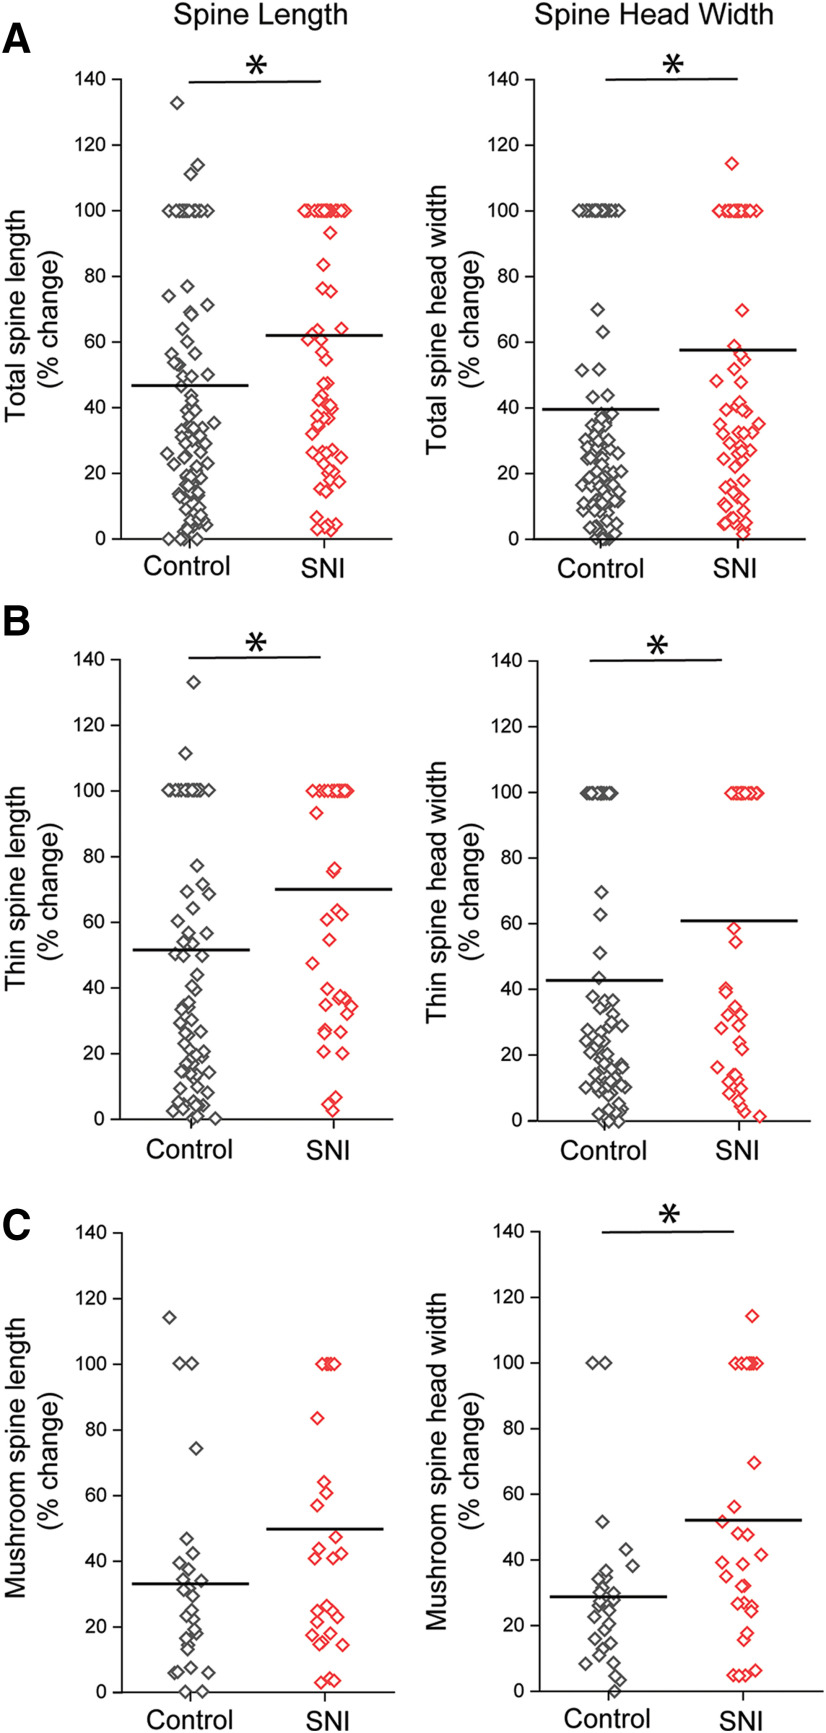
Figure 6.
Dendritic spine length and head width dynamics over 7 d after SNI. A, Absolute % change in spine length and head width of total spines, which includes all spine shape categories. SNI induced greater % change in total spine length and width during a 7 d interval compared with controls. B, Absolute % change in spine length and head width of thin-shaped spines. After SNI, thin spines displayed a greater % change in spine length and head width over 7 d compared with controls. C, Absolute % change in spine length and head width in mushroom spines. SNI induced an increase in spine head width dynamics compared with controls. *p < 0.05 (Mann–Whitney test).

