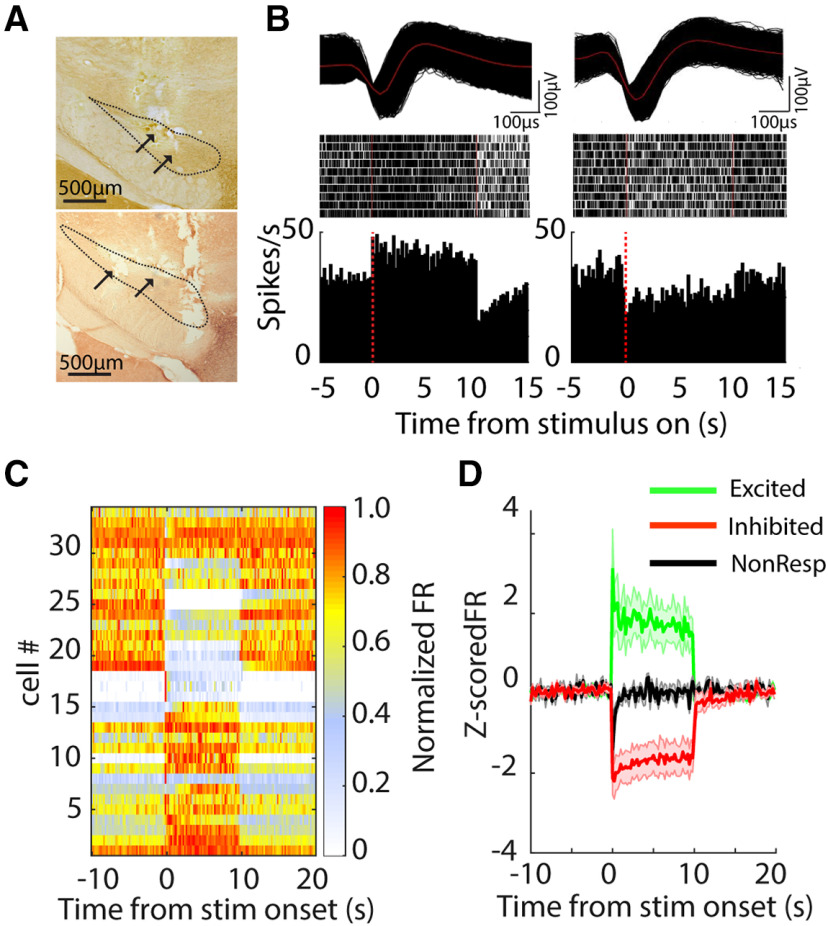
Figure 6.
Changes in neural activity in the STN during 130-pps optogenetic STN DBS. A, Two TH-stained representative coronal sections show the fiber/electrode tracks within STN. B, top, Action potential waveforms of two representative single units. Middle, Rastergrams of two representative neurons responding to 130-pps optical stimulation in a Chronos-injected rat. Each row in raster plot represents a single trial. Bottom, Poststimulus histograms of representative neurons. STN neurons selectively increased or decreased firing rates when the light stimulus was turned on. C, Heatmap of neural firing rate sorted by responses to light stimulus for excited, inhibited, and non-responsive neurons; x-axis indicates time from stimulus onset and each row represents the firing rate normalized by the maximum firing rate of each neuron. D, Z-score normalized population firing rate of excited, inhibited, and non-responsive neurons.

