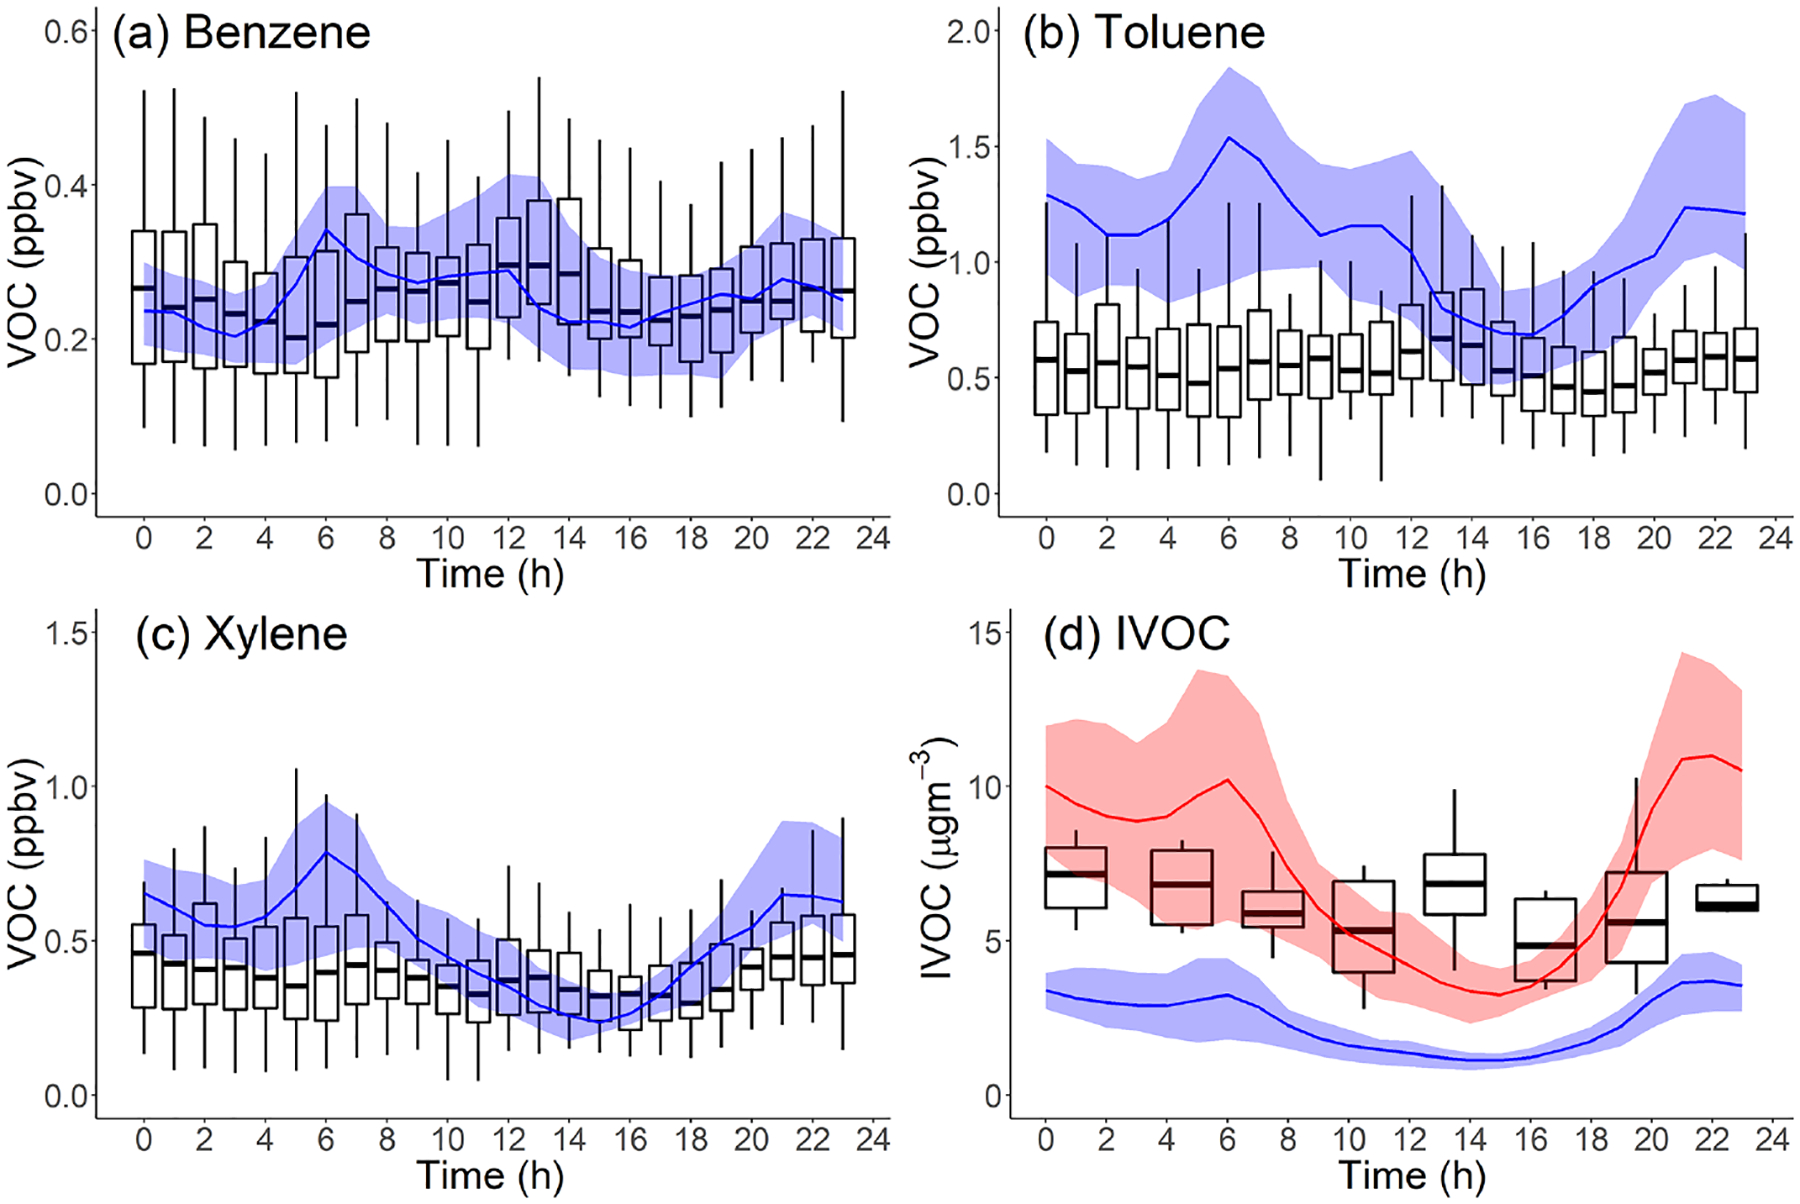
Figure 4.

Comparison of measured (boxplot: solid box denotes 25th to 75th percentiles and whiskers denote 10th to 90th percentiles) and modeled (line: shaded area denotes 25th to 75th percentiles) diurnal patterns in Pasadena, CA, during CalNex for the following species: (a) benzene, kOH = 1.22 × 10⁻¹² cm3 molec−1 s−1; (b) toluene, kOH = 5.63 × 10⁻¹² cm3 molec−1 s−1; (c) xylene, kOH = 1.36 – 1.87 × 10⁻¹¹ cm3 molec−1 s−1; and (d) hydrocarbon IVOCs (blue: Case 2, red: Case 3), kOH = 1.55 – 7.56 × 10⁻¹¹ cm3 molec−1 s−1. Measured data from Borbon et al. (2013).
