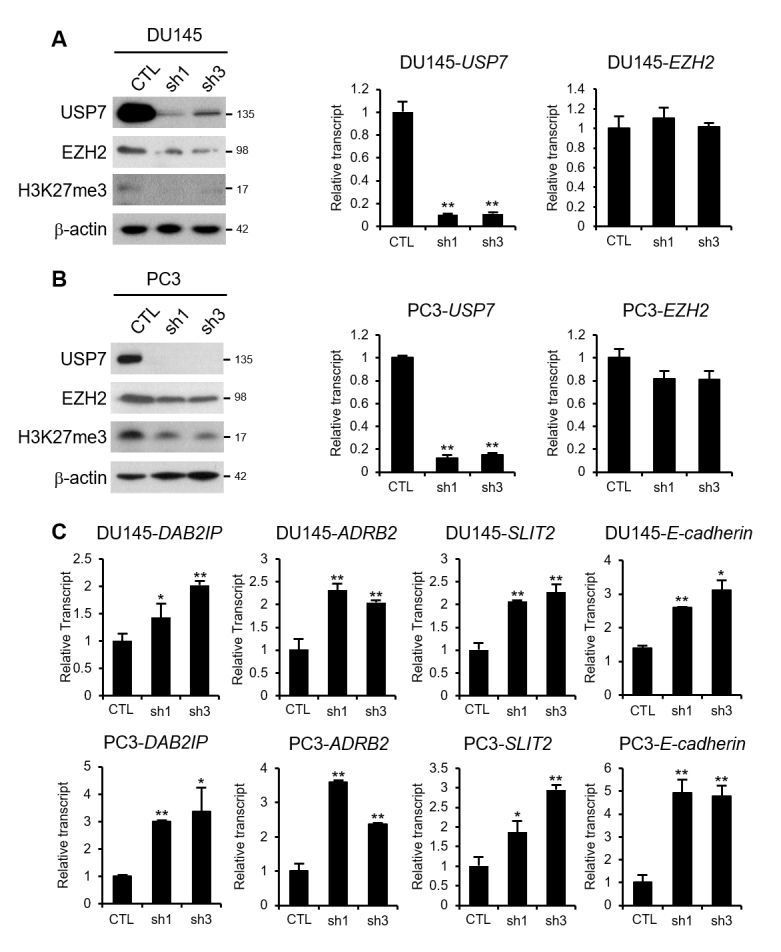
Figure 4. EZH2-repressive target genes are derepressed by USP7-knockdown. (A) Western blot analysis of USP7, EZH2, and H3K27me3 levels in USP7-knockdown DU145 cells. Real-time RT-PCR analysis of the transcript levels of USP7 and EZH2 in USP7-knockdown DU145 cells. (B) Western blot analysis of USP7, EZH2, and H3K27me3 levels in USP7-knockdown PC3 cells. Real-time RT-PCR analysis of the transcript levels of USP7 and EZH2 in USP7-knockdown PC3 cells. (C) Real-time RT-PCR analysis of the transcript levels of DAB2IP, ADRB2, SLIT2, and E-cadherin in USP7-knockdown DU145 or PC3 cells. Values are expressed as the mean ± SD of three independent experiments. The p value was obtained by Student’s t-test. *p < 0.05, **p < 0.01.

