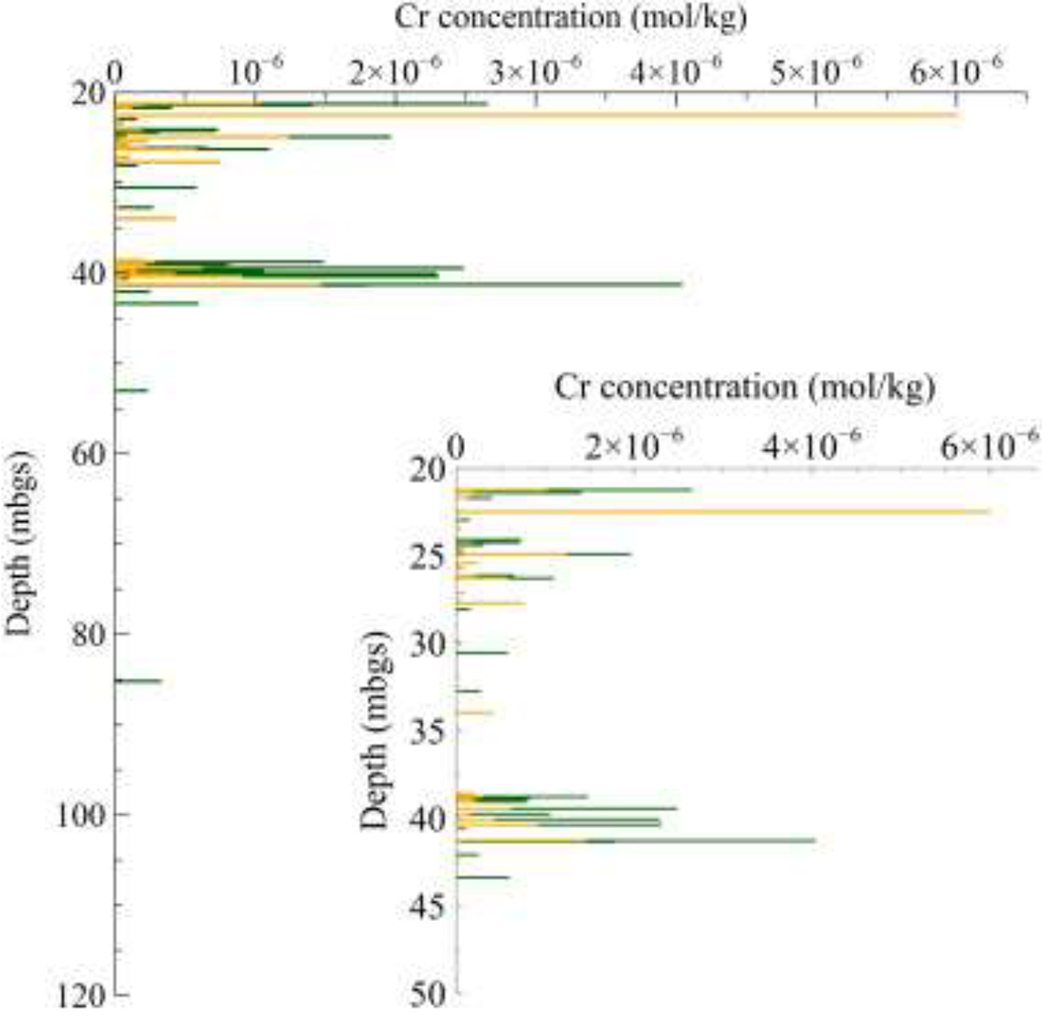
Fig. 4.

Stacked bars showing background-corrected data for extractable Cr(VI) and labile Cr(III). The dark yellow bars represent the concentration of Cr(VI), whereas the dark green bars represent labile Cr(III). The ground surface elevation at the drill-hole location is 5.0 m ASL. (For interpretation of the references to color in this figure legend, the reader is referred to the web version of this article.)
