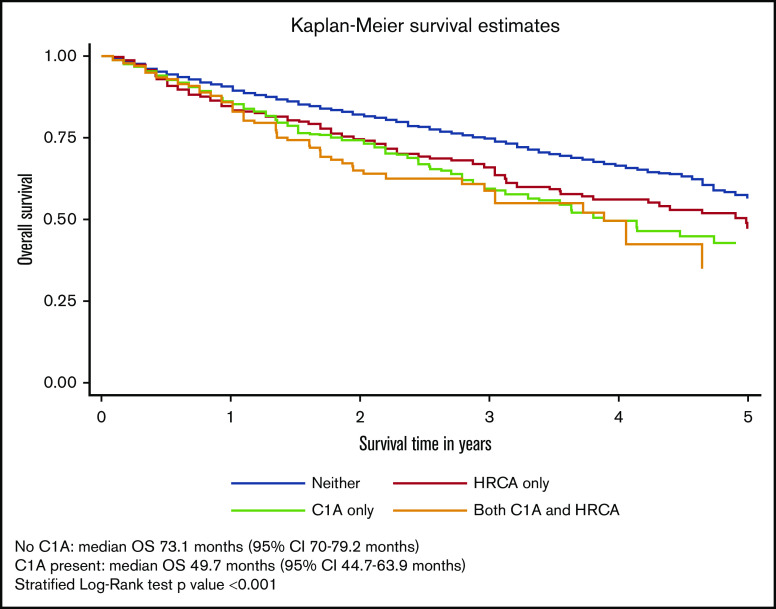
Figure 2.
OS of patients with MM and with or without C1As. Survival distributions were plotted using Kaplan-Meier methods. Because patients with C1As were also more likely to have HRCAs, we created a 4-level measure that combined them: neither C1As nor HRCAs, HRCAs present/no C1As, C1As present/no HRCAs, and C1As and HRCAs present. Differences in survival distributions between those with and without C1As were tested with log-rank statistics, accounting for HRCAs as a stratifying variable, and the results were statistically significant (P < .001).

