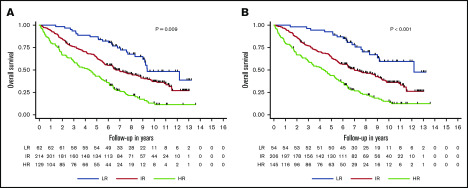
Figure 3.
Kaplan-Meier OS estimates for 405 patients with FISH 1q data with corresponding numbers at risk. Stratification is by LR, IR, and HR groups incorporating base model predictors of R-ISS and age ≥70 years (A) and base model and gain 1q by FISH (B). Corresponding P values for log-rank tests are provided.

