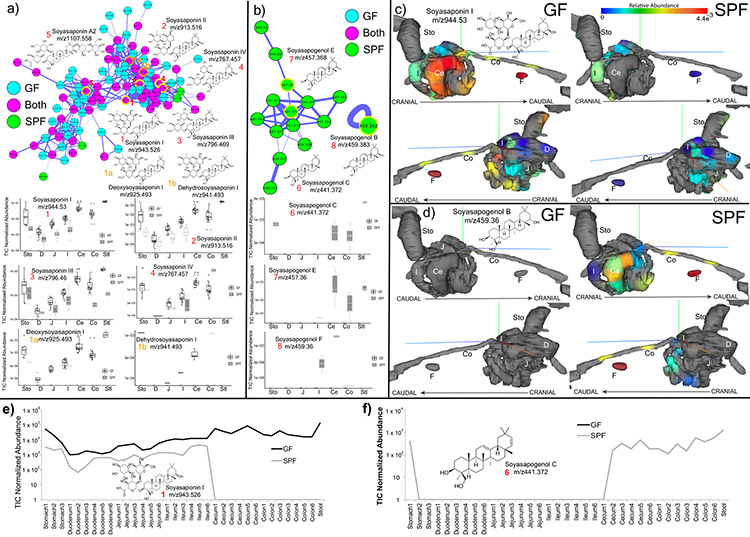
Extended Data Fig. 2. Microbial metabolism of soyasaponins in GF and SPF metabolomics data (n=4).
a) Molecular network cluster of soyasaponins colored by source of each node as GF, SPF or shared. Structures of corresponding molecules are shown in nodes highlighted in yellow according to the numbering scheme. Mean total ion current normalized (TIC) abundance of each soyasaponin metabolite from the murine GI tract in the GF and SPF mice (Sto=Stomach, D=Duodenum, J=Jejunum, I=Ileum, Ce=Cecum, Co=Colon, Stl=Stool) (Boxes represent the IQR, the center is the median, and whiskers are 1.5x the IQR, n=4). b) Molecular family of soyasapogenols, their structures and relative abundances in GF and SPF gut organs (data same format a s in a)). c) ‘ili 3-D model visualization of the normalized abundance of soyasaponin I in the murine GI tract. Abundance of the metabolite is indicated according to the viridis spectrum (high red/hot colors, low blue/cool colors) n=4. d) ‘ili 3D cartography of the normalized abundance of soyasapogenol B onto an MRI organ model of the mice. e) Mean normalized abundance of soyasaponin I through all GI sample locations in the GF and SPF mice. f) Mean normalized abundance of soyasapogenol through all GI sample locations. The annotations are level 2 or 33.

