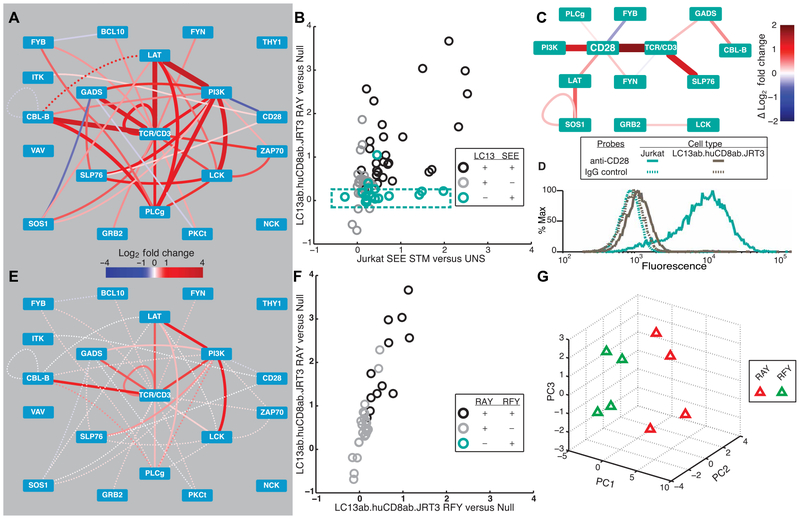
Fig. 1. PiSCES signatures reveal differential qualitative and quantitative TCR-proximal signaling activities.
(A) PiSCES signature of LC13ab.huCD8ab.JRT3 cells stimulated with agonist peptide (FLRGRAYGL) for 5 min (mean log2 fold change, stimulated/basal; dotted lines indicate trend of nonsignificant protein pairs that appear as hits for data comparisons shown ahead). (B) Comparison of mean log2 fold changes in abundance of protein pair hits induced by agonist pMHC in LC13ab.huCD8ab. JRT3 cells versus SEE superantigen in Jurkat cells. Statistically significant hits that occurred in both stimuli are black, hits in LC13 system only are gray, and hits in SEE-Jurkat system are teal. (C) Subnetwork [from (B), teal points within the teal dashed box] visualized as the difference in mean log2 fold change in SEE versus LC13. (D) Surface staining with anti-CD28 or immunoglobulin G (IgG) negative control for Jurkat versus LC13ab.huCD8ab.JRT3 cells. (E) PiSCES signature of LC13ab.huCD8ab.JRT3 cells stimulated with antagonist peptide (FLRGRFYGL) for 5 min (mean log2 fold change, stimulated/basal; dotted lines indicate trend of nonsignificant protein pairs). (F) Comparison of mean log2 fold changes in abundance of protein pair hits induced by LC13 agonist versus antagonist stimulation. Compared with (B), note lack of teal “antagonist-only” hits. (G) PCA of four independent experiments shows separation of 5-min agonist versus antagonist PiSCES signatures.

