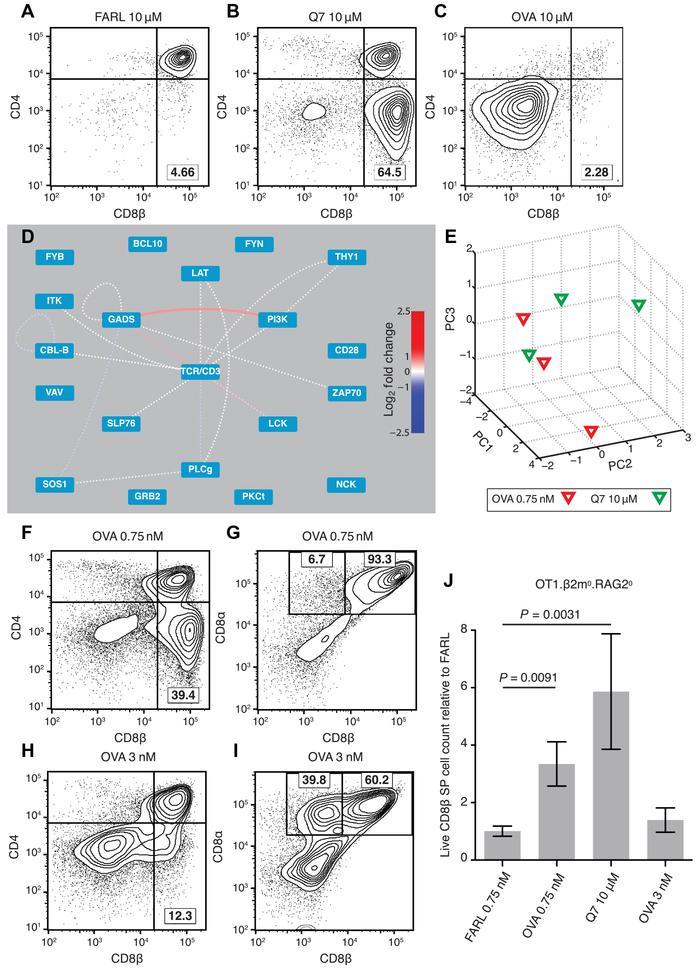
Fig. 4. PiSCES signature makes quantitative signaling prediction, which passes functional test in FTOC.
(A to C) Fetal thymi of genotype OT1.RAG20.β2m0 were cultured for 7 days in the presence of exogenous β2m and specific peptides at the stated concentrations. (A) FARL peptide (10 μM) loads with high affinity into H-2Kb but has no functional affinity for the OT1 TCR and represents the background no-selection condition. (B) Q7 (10 μM) induced positive selection of a substantial portion of CD8 SP cells. (C) OVA (10 μM) induced deletion and loss of CD8+ cells. (D and E) Lowering the dose of OVA peptide to 0.75 nM made its PiSCES signature almost indistinguishable from that of 10 μM Q7. (D) When PiSCES data resulting from 5-min stimulation of preselection OT1.β2m0.RAG20 thymocytes with 0.75 nM OVA were normalized to data from stimulation with 10 μM Q7, the signatures virtually cancelled out, eliminating almost all hits (mean log2 fold change, OVA/Q7 comparison; dotted lines indicate trend of nonsignificant protein pairs). (E) PCA of PiSCES data in four experiments described in (D), where separation of the two stimulatory conditions was no longer observable. (F) OVA (0.75 nM) in FTOC induced positive selection of CD8 SP cells (lower right quadrant). (G) Gating the data in (F) on CD4(−) cells, the positively selected CD8 SP cells were largely conventional σβ T cells marked by CD8αβ expression. (H) Raising OVA concentration to 3 nM in FTOC still induced positive selection of CD8 SP cells. (I) Gating the data in (H) on CD4(−) cells, many of the positively selected cells were seen to represent unconventional CD8α+ CD8β− cells. (J) Live CD8β+ SP T cell counts from two independent experiments [including the experiment depicted in (A) to (C) and (F) to (I)], with each FTOC normalized to the mean of its corresponding FARL 0.75 nM condition and reported as fold change. Number of thymus lobes per condition: 9 (FARL 0.75 nM), 9 (OVA 0.75 nM), 4 (Q7 10 μM), and 6 (OVA 3 nM). Unpaired two-tailed Student’s t test, P < 0.01.

