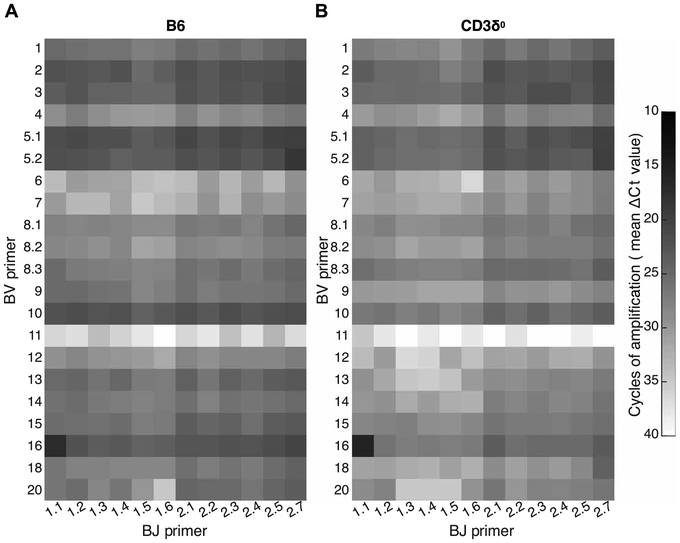
Fig. 7. Diverse TCR repertoire in B6 and CD3δ0 mice.
A qPCR matrix-based method was used to assess relative representation of all possible TCRβ V-J combinations expressed as transcripts in splenocytes from two (A) B6 or (B) CD3δ0 mice. To approximate the maximum diversity generation potential per mouse for each genotype, the mean cycle threshold (Ct) value from the two mice with highest Shannon entropy for each genotype is displayed (top 2 of four B6 mice and top 2 of six CD3δ0 mice tested, when 15-ng total splenic RNA was used as input). As expected, because of higher T cell representation among splenocytes, B6 transcripts for TCR were more abundant than was found in CD3δ0. Greater quantities of specific transcripts appear darker due to fewer PCR amplification cycles required to reach Ct.

