
Fig 2. Associations of rs746039 (ITPR1) with fetal weight and head circumference across 13–40 weeks gestation.
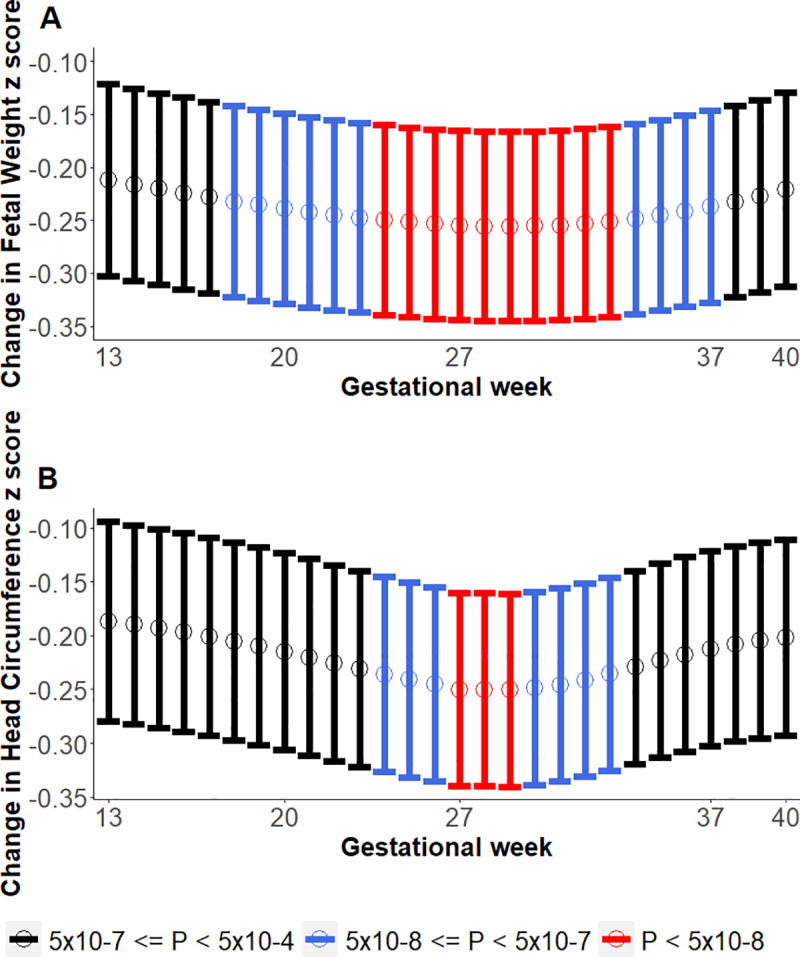
Y-axis shows change in fetal weight z-score per allele. Lower and upper bounds of 95% Confidence Intervals shown via the vertical lines along the mean points. Colors of vertical lines denote where genome-wide association P-values: red (P < 5x10⁻⁸), blue (5x10⁻⁸ ≤ P < 5x10⁻⁷), and black (5x10⁻⁷ ≤ P <5x10⁻⁴). A. Fetal weight. B. Head circumference.