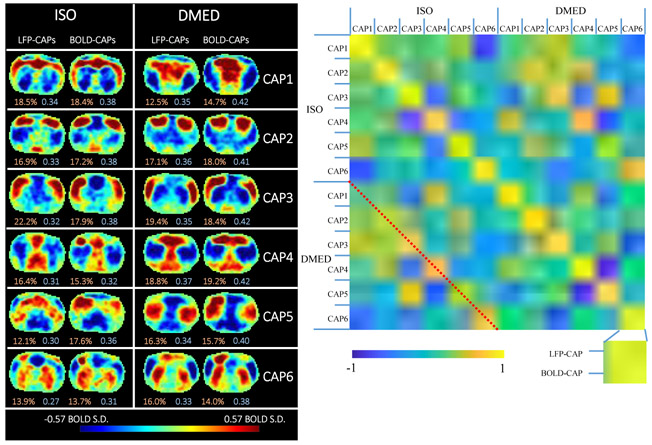
Figure 5. Temporal decomposition of the selected co-activation frames (left) and the similarity matrix (right).
The frames selected based on high amplitude events are further divided into six clusters using the k-means algorithm (k=6) to produce CAPs. The threshold used for selecting frames was 15% for both LFP-CAPs and BOLD-CAPs. The LFP-CAPs under ISO are sorted based on the consistency (the average spatial similarity of each fMRI frame to the group mean). The LFP-CAPs under DMED are sorted to maximize the summed spatial similarity between LFP-CAPs under ISO and LFP-CAPs under DMED (for easier comparison across different anesthetic conditions). The BOLD-CAPs are also sorted in a similar way using LFP-CAPs as the benchmark. The consistency (light red) and fraction values (light blue) of the CAPs are shown on the bottom of each image. The similarity matrix shows the spatial similarity (Pearson correlation) between any combinations of two CAPs. Within each anesthetic agent group, there are 6 different CAPs groups. Within each CAP group, there are also two elements: LFP-CAP and BOLD-CAP, giving 24x24 elements visualized in this matrix

