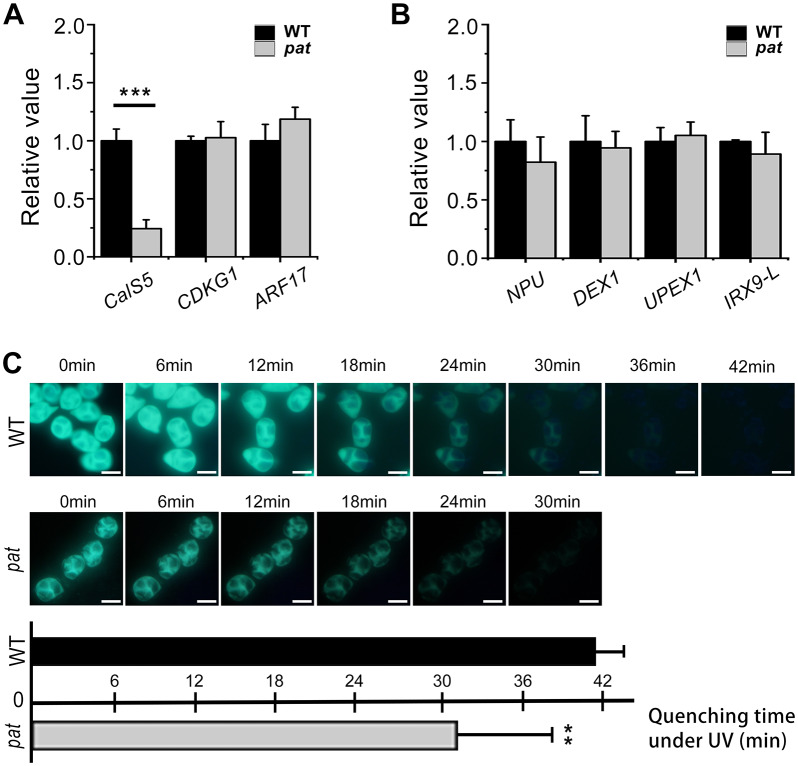
Fig 4. Reduced callose synthesis in pat is associated with the decreased CalS5 expression.
Expression of genes involved in callose synthesis (A) and genes involved in primexine formation (B) were detected in wild-type and pat plant inflorescences. Error bars represent the SD (n = 3). *** p < 0.001 (t-test). (C) Callose fluorescence quenching assay showed that callose wall fluorescence in pat quenched faster than that in WT. Error bars represent the SD of the mean of 12 biological replicates. ** p < 0.01 (t-test). Scale bars, 20 μm.

