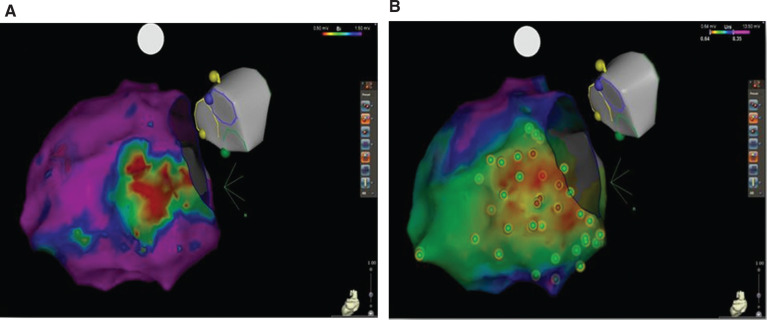
Figure 1:
A: Electroanatomic bipolar map with evidence of posterior basal endocardial scar, defined by a scar threshold of less than 1.5 mV. B: Unipolar endocardial map showing a larger scar area with a low-voltage area (< 8.3 mV). Images courtesy of mages courtesy of Andrew E. Darby, MD, of the University of Virginia.

