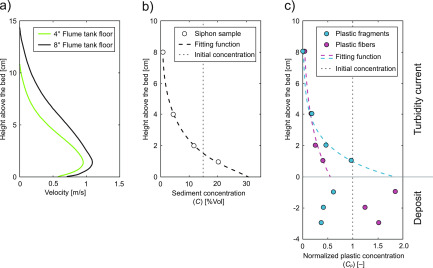
Figure 3.
Velocity profiles of the turbidity current (a) measured by the Ultrasonic Velocity Probe located 2.8 m downstream of the inlet box. Vertical sediment concentration per volume of the turbidity current (b). Concentration of melamine fragments and polyester fibers (c) in the turbidity current and in the deposits. Values are normalized with the initial concentrations in the mixing tank.

