Figure 1.
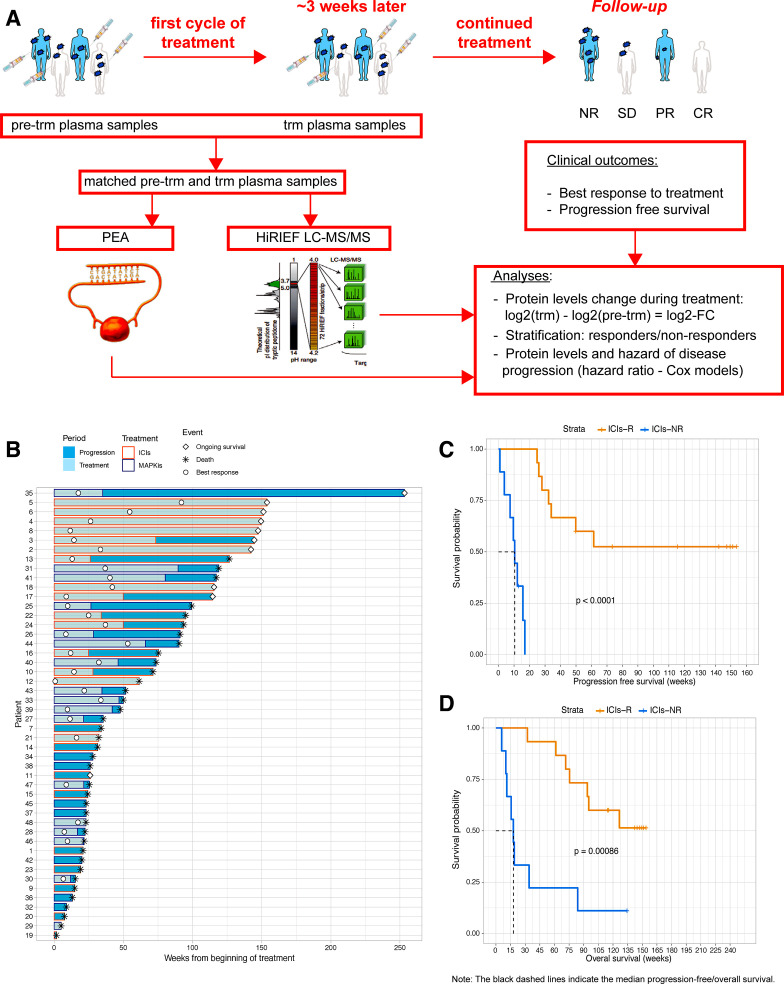
Sequential biobanking of plasma samples and treatment outcome of all patients included in the study. (A) Workflow of the study. Plasma samples were collected pretreatment at baseline and during treatment with ICIs in the study cohort or with MAPKis in the comparison cohort. Treatment outcomes were followed prospectively. (B) Swimmers’ plot on patient and treatment follow-up. All patients, except patients 35, 6, 4, and 3, had matched samples for PEA analyses. Patient 35 received MAPKis as first-line treatment, followed by ICIs at progression and is the longest survivor—this is the most evident example how additional treatments after progression can affect overall survival and why analyzing progression-free survival is a more valid outcome in this study.; (C and D) Kaplan-Meier curves on progression-free survival (C) and overall survival (D) in patients on ICIs, stratified per treatment response (p values—two-sided log-rank test). PEA image courtesy of Olink Proteomics AB. CR, complete response; HiRIEF LC-MS/MS, high-resolution isoelectric focusing liquid chromatography–mass spectrometry; ICIs, immune checkpoint inhibitors; ICIs-NR, patients treated with ICIs with no response to treatment; ICIs-R, patients treated with ICIs with response to treatment; log2-FC, log2-fold-change; MAPKis, mitogen-activated protein kinase inhibitors; NR, no response; PEA, proximity extension assays; PR, partial response; pre-trm, pre-treatment; SD, stable disease; trm, after the first treatment cycle.

