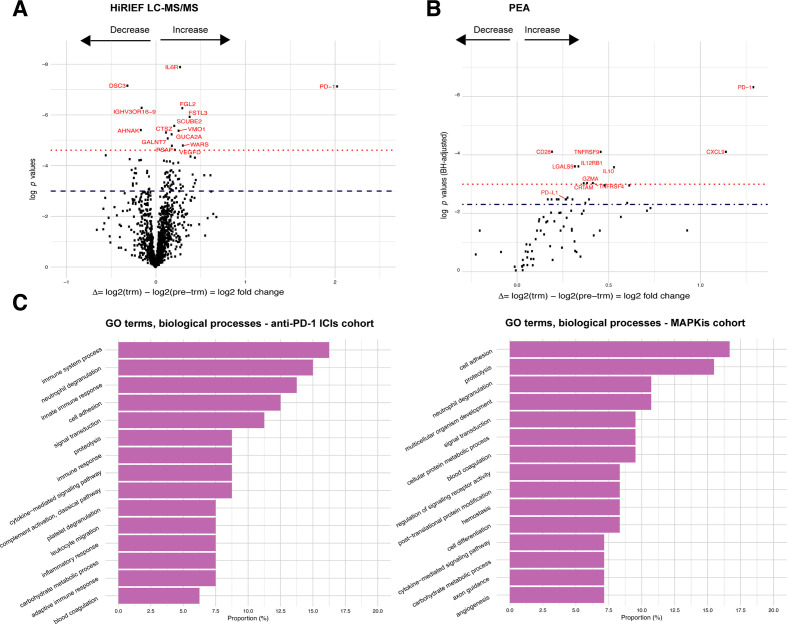
Figure 2.
Change (log2-FC) in protein plasma levels during anti-PD-1 treatment in metastatic cutaneous melanoma. (A) Volcano plots on comparing trm with pre-trm protein plasma levels in all patients with matched samples who were treated with anti-PD-1 ICIs, HiRIEF LC-MS/MS analyses (paired t test, two sided). Proteins above the dashed line = p< 0.05, proteins in red and above the dotted line = p< 0.001 (no FDR). (B) Volcano plots on comparing trm with pre-trm protein plasma levels in all patients with matched samples who were treated with anti-PD-1 ICIs, PEA analyses (paired t test, two sided). Proteins above the dashed line = q< 0.1, proteins in red and above the dotted line = q< 0.05 (p<0.05, 10% FDR). (C) Distribution of GO terms on biological processes of proteins that had a significant change in plasma levels during treatment in the anti-PD-1 treatment cohort (left) and in the MAPKi treatment cohort (right). PD-1, programmed cell death protein 1; GO, gene ontology; HiRIEF LC-MS/MS, high-resolution isoelectric focusing liquid chromatography–mass spectrometry; ICIs, immune checkpoint inhibitors; IL10, interleukin10; log2-FC, log2-fold-change; MAPKis, mitogen-activated protein kinase inhibitors; PEA, proximity extension assays; pre-trm, pre-treatment; trm, after the first treatment cycle.

