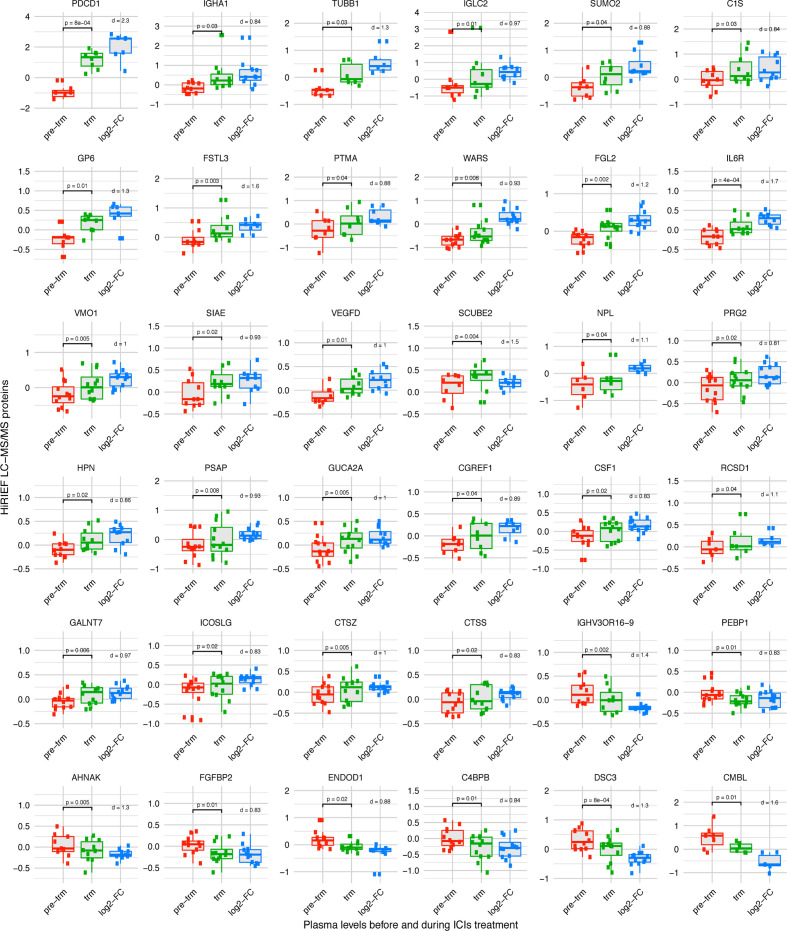
Figure 3.
Proteins with a change (log2-FC) in plasma levels during treatment with anti-PD-1 ICIs. Proteins which had the largest effect size (Cohen’s d >0.81) are shown, analyzed with HiRIEF LC-MS/MS (paired t test, two sided, α=0.05). Multiple testing has likely contributed to type I error. However, the discoveries are more reliable in proteins whose change during treatment is of larger effect size (Cohen’s d). Boxplots: center line = median; box limits = upper and lower quartiles; whiskers = 1.5 x IQR; points outside of IQR = outliers. Proteins with log2-FC>0 = increase, log2-FC <0 = decrease; Cohen’s d=0.8 = large effect size, Cohen’s d=1.2 = very large effect size, Cohen’s d=2 = huge effect size. None of these proteins had a change in plasma levels during treatment with MAPKis. PD-1, programmed cell death protein 1; HiRIEF LC-MS/MS, high-resolution isoelectric focusing liquid chromatography–mass spectrometry; ICIs, immune checkpoint inhibitors; IL6R, interleukin-6 receptor; log2-FC, log2-fold-change; MAPKis, mitogen-activated protein kinase inhibitors; pre-trm, pre-treatment; trm, after the first treatment cycle.

