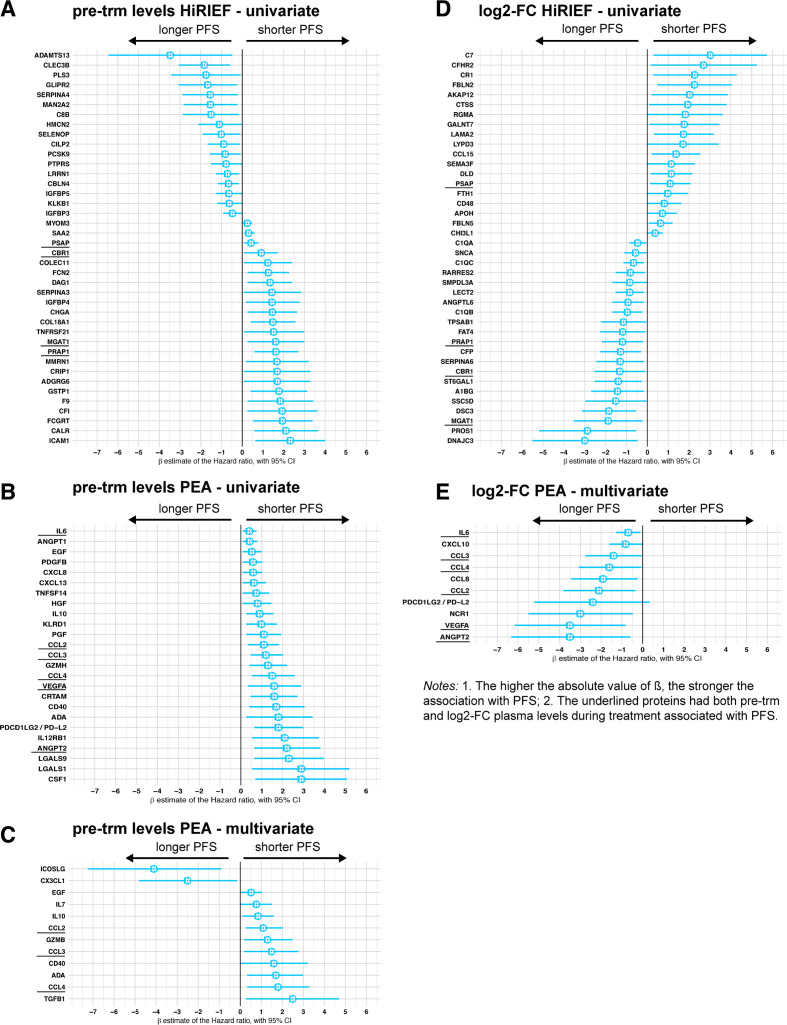
Figure 5.
Forest plots on association between protein plasma levels and progression-free survival (PFS), Cox models. High-resolution isoelectric focusing liquid chromatography–mass spectrometry (HiRIEF LC-MS/MS) data, levels pre-trm (A) and log2-fold change (log2-FC) (D); Proximity extension assays (PEAs) data, levels pre-treatment (pre-trm) (univariate analyses—B, multivariate—C) and log2-fold change (E). Dots = β estimate=log2 of HR, interval bars=95% CI of the β estimate. The β in HiRIEF LC-MS/MS data is underestimated (see section on Cox models in Additional File 1). HiRIEF data included only patients with anti-programmed cell death protein 1 (anti-PD-1) treatment, whereas PEA data included patients treated with anti-PD-1 and/or anti-cytotoxic T-lymphocyte–associated antigen 4.

