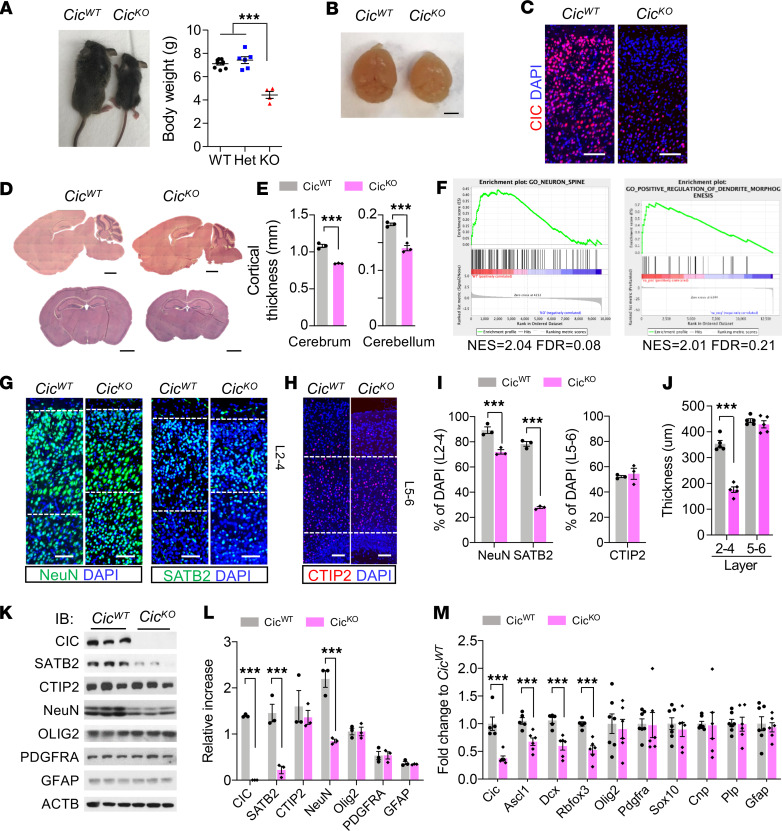
Figure 1. Defective cerebral cortex developments in CicKO mouse.
(A) The picture (left) and the plot for body weights (right) at P14. Statistical significance was determined by 1-way ANOVA. Mean ± SEM of 4–10 experimental animals. ***P < 0.001. (B) The brains at P14. (C) IF analysis for CIC in the cerebral cortex. Scale bar: 100 μm. (D) H&E staining of CicWT and CicKO brains. Scale bar: 1 mm. For B–D, 3 brains per group were examined, and representative images are shown. (E) Quantification of the thickness cerebral cortex (left) and cerebellar cortex (right) are plotted. Mean ± SEM of 3 experimental animals. (F) GSEA in CicKO versus CicWT brains. Two brains per group were analyzed. (G and H) IF analysis for NeuN, SATB2, and CTIP2 in the cerebral cortex of P14 mouse. Scale bar: 100 μm. (I) Quantifications at layers 2–4 of NeuN+ or SATB2+ and layers 5–6 of CTIP2+ numbers are plotted. Mean ± SEM of 200 DAPI+ nuclei from 3 animals. (J) Measurement the thickness for SATB2+ layers 2–4 and CTIP2+ layers 5–6. Mean ± SEM of 3 images from 3 animals. (K) WB analysis for indicated protein expressions in cerebral cortex lysates. Samples were run on 3 gels, and the most representative ACTB blot is shown. (L) Densitometry analysis of multiple WB in J is plotted. Mean ± SEM of 3 experimental animals. (M) qPCR results of indicated genes in P14 CicKO versus CicWT brains. Mean ± SEM of 5–7 experimental animals. For I, J, L, and M, statistical significance was determined by unpaired t test. ***P < 0.001.

