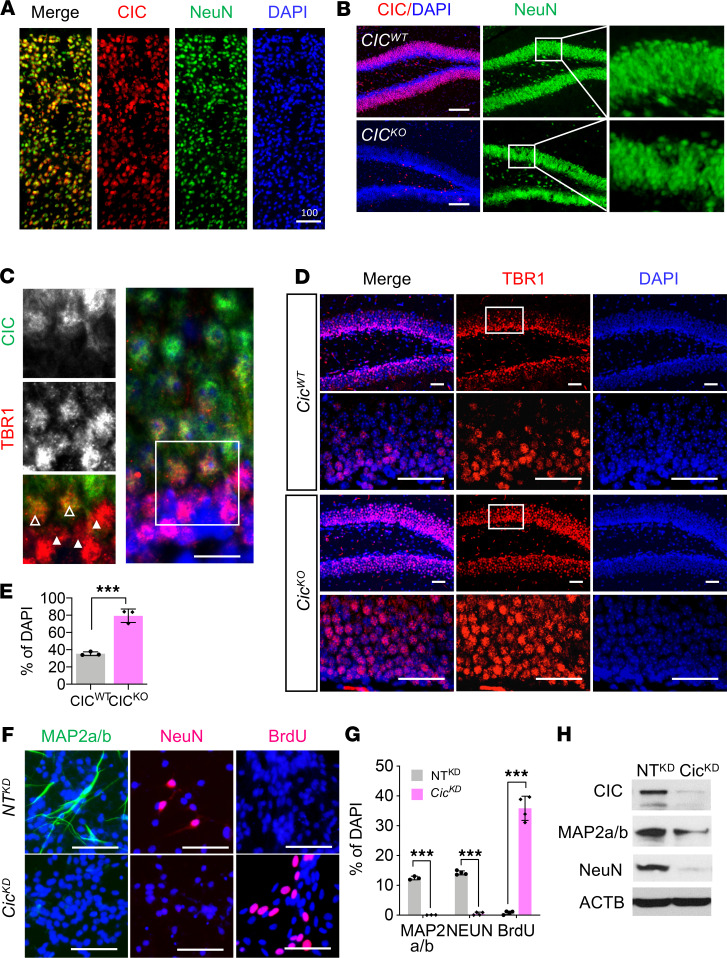
Figure 2. Loss of CIC compromises neuronal maturation.
(A and B) IF analysis for CIC and NeuN. Scale bar: 200 μm. Inset magnification: 400×. (C) Co-IF for TBR1 and CIC expression in hippocampus. Open arrowheads point to TBR1-low cells, and closed arrowheads are on TBR1-high cells. Inset magnification: 800×. (D) IF analysis for TBR1 in P14 CicWT and CicKO brains. Scale bar: 50 μm. Inset magnification: 400×. For A–D, 3 animals were examined, and representative images are shown. (E) TBR1-high cells of images in D are counted. Mean ± SEM of the measurement from 50–60 DAPI from 3 animals. (F) IF analysis for MAP2a/b, NeuN, and BrdU in NTKD NPC and CicKD NPC at 8 days of differentiation. Scale bar: 50 μm. (G) Quantitation of experiments in F. Mean ± SEM of the measurement from 100 DAPI+ nuclei from 3 independent experiments. For E and G, statistical significance was determined by unpaired t test. *** P < 0.001. (H) WB analysis for each specific marker at day 5 of differentiation. Three experiments were conducted, and a representative result is shown. Samples were run on 2 gels, and the representative ACTB blot is shown.

