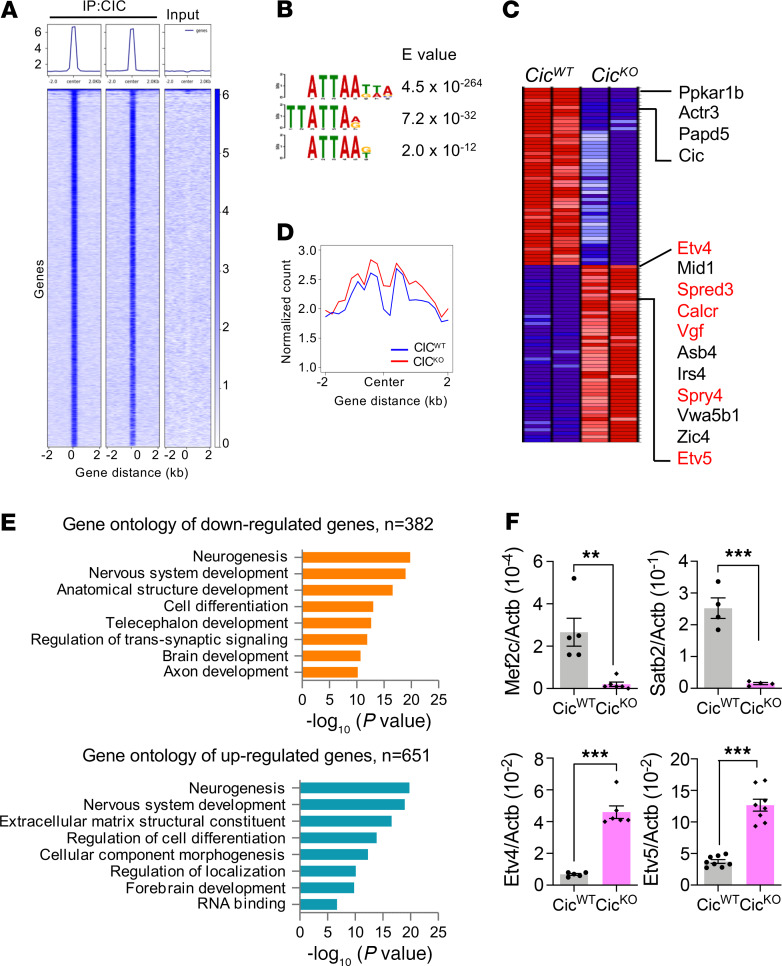
Figure 3. CIC represses transcriptional targets in developing brains.
(A) Heatmaps at CIC peaks showing CIC (n = 2) and input. (B) Motif analysis. (C) Heatmap of the top 50 ranked differentially expressed genes in RNA-seq analysis of CicKO vs. CicWT. Genes with CIC ChIP peaks are marked red. (D) Average ChIP-seq signal of H3K27Ac at CIC peaks from P0.5 brains of CicWT and CicKO. (E) Gene ontology analysis with RNA-seq in P0.5 brains of CicWT and CicKO. The up- or downregulated genes were retrieved with P < 0.02. (F) qPCR results of Mef2c, Satb2, Etv4, and Etv5 mRNA expressions in P0.5 brains of CicWT and CicKO. Mean ± SEM of 5 experimental animals. Statistical significance was determined by unpaired t test. **P < 0.01, *** P < 0.001.

