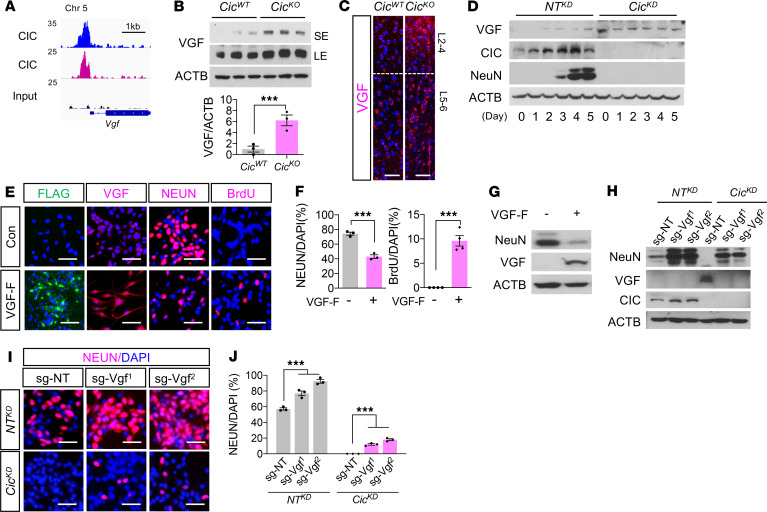
Figure 4. Aberrant expression of VGF compromises neurogenesis in CIC-deficient brains.
(A) Biological replicates of CIC ChIP-seq tracks at Vgf promoter regions. (B) WB analysis in P0.5 brains of CicWT and CicKO mouse. SE, short exposure; LE, long exposure. The blots were run on same gel. Mean ± SEM of 3 experimental animals. (C) IF analysis for VGF in the P14 brains of CicWT and CicKO. Scale bar: 100 μm. (D) WB analysis for VGF in NTKD NPC and CicKD NPC during differentiation. The blots were run on same gel. (E) IF analysis for Flag, VGF, NeuN, and BrdU in VGF-Flag–expressed NPC (VGF-F) and control NPC (con) at 7 days of differentiation. Scale bar: 50 μm. (F) Quantitations for NeuN+ or BrdU+ numbers are plotted. Mean ± SEM of 100 DAPI+ nuclei from 3 experiments. (G) WB analysis for indicated proteins in control NPC and VGF-F NPC at 5 days of differentiation. (H) WB analysis for indicated proteins in NTKD NPC and CicKD NPC at 4 days of differentiation. sg-NT, nontargeted control single-guide RNA. For G and H, samples were run on 2 gels, and the representative ACTB blot is shown. (I) IF analysis for NEUN in NTKD NPC and CicKD NPC at 7 days of differentiation. (J) Quantifications for images from I are plotted. Mean ± SEM of 100 DAPI+ nuclei from 3 experiments. Statistical significance was determined by unpaired t test for B and F and 1-way ANOVA for J. *** P < 0.001. For C, D, E, G, H, and I, 3 experiments were conducted, and each representative result is shown.

