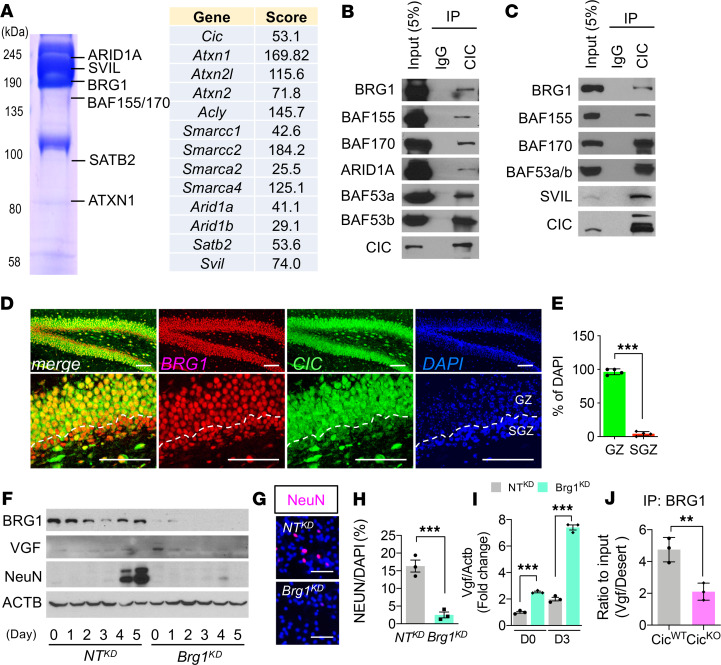
Figure 6. mSWI/SNF complex is a molecular partner for CIC-dependent transcriptional regulation.
(A) The partial list of CIC-interacting proteins analyzed by mass spectrometry. (B) Co-IP analysis of CIC with components of the mSWI/SNF complex after expression in HEK293T cells. (C) Co-IP analysis of endogenous proteins from P0.5 brains. For B and C, a single experiment was conducted. (D) Co-IF analysis of CIC and BRG1 in P14 brains. Scale bar: 100 μm. (E) Ratio of CIC and BRG1 coexpressed cells to DAPI+ nuclei in D. GZ, granular zone. Mean ± SEM of the measurement from 50 DAPI+ nuclei from 3 animals. (F) WB analysis of differentiation time course of NTKD NPC and Brg1KD NPC. The blots were run on same gel. Three experiments were conducted, and a representative result is shown. (G) IF analysis for NeuN at day 7 of differentiation. Scale bar: 50 μm. (H) Quantitation of NeuN+ cells from G. Mean ± SEM of 100 DAPI+ nuclei from 3 experiments. (I) qPCR results for Vgf mRNA expression in NTKD NPC and Brg1KD NPC at day 0 (D0) and D3 of differentiation. Mean ± SEM of 3 experiments. (J) ChIP-qPCR results from IP of BRG1 from NTKD NPC and Brg1KD NPC at Vgf promoter regions. Mean ± SEM of 3 experiments. Statistical significance was determined by unpaired t test for E, H, and J and 1-way ANOVA for I. **P < 0.01, *** P < 0.001.

