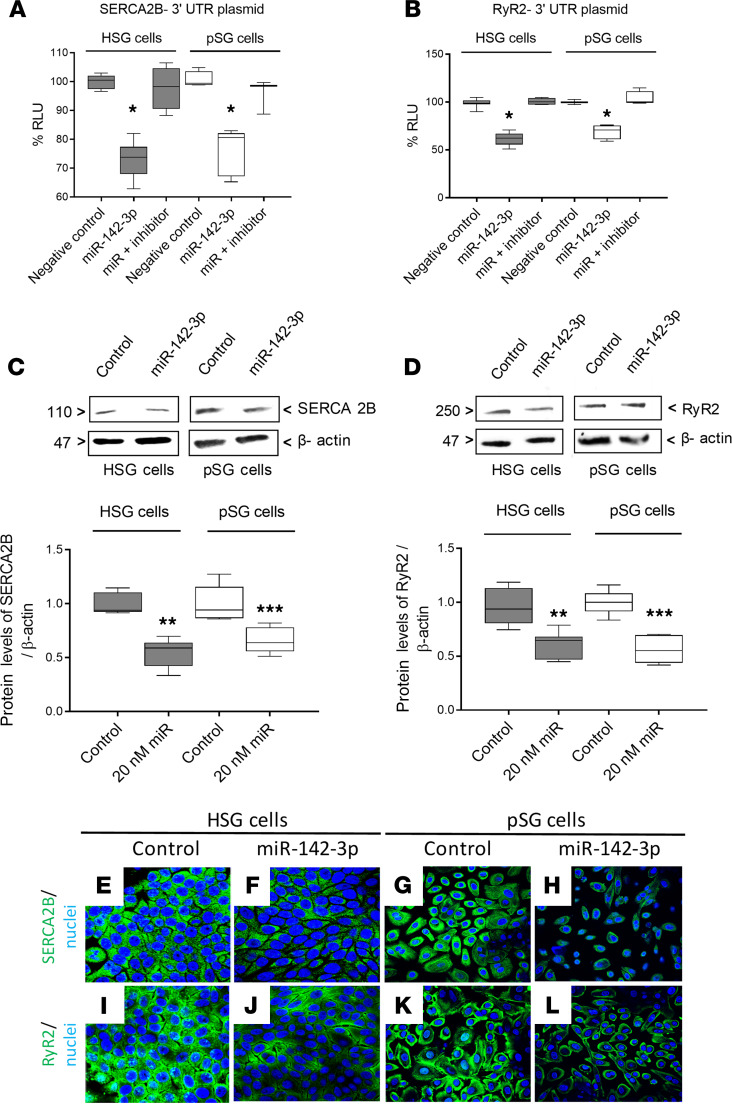
Figure 2. SERCA2B and RyR2 are both targets of miR-142-3p in HSG and pSG cells.
(A and B) Dual luciferase reporter assays in HSG and pSG. Cells were cotransfected with plasmid 3′-UTR SERCA2B or 3′-UTR RyR2 and miR-142-3p mimic or miRNA hairpin inhibitor. Luciferase activity was measured in relative light units (RLU) (n = 4, median, maximum, and minimum shown). Statistical significance was determined by Mann-Whitney nonparametric test; *P < 0.05. (C and D) Protein levels of SERCA2B and RyR2 in HSG and pSG transfected with or without miR-142-3p mimic. (n = 5, median, maximum, and minimum shown; **P < 0.01, and ***P < 0.001 determined by Mann-Whitney nonparametric test.) The box plots depict the minimum and maximum values (whiskers), the upper and lower quartiles, and the median. The length of the box represents the interquartile range. (E–L) Immunofluorescence staining for SERCA2B and RyR2 (both green) in HSG and pSG transfected with or without miR-142-3p mimic. Cell nuclei were stained DAPI (blue). Scale bar: 10 μm. (n = 3 experiments per condition, 3 fields of view evaluated per experiment.)

