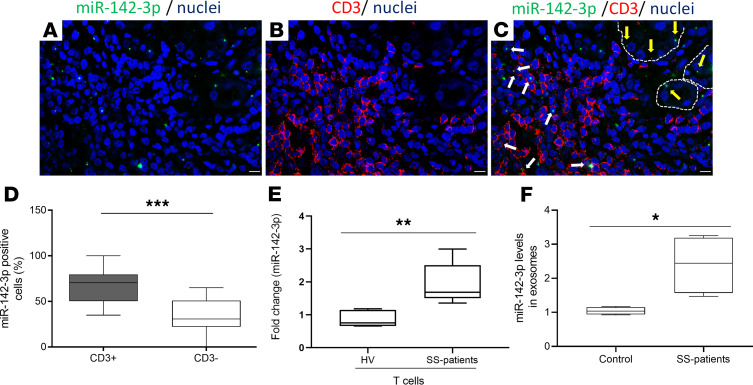
Figure 5. miR-142-3p is upregulated in salivary gland lesions and within secreted T cell exosomes from patients with SS.
(A–C) ISH for miR-142-3p (green) and immunofluorescence staining for CD3+ T cells (red) were performed on paraffin-embedded sections from minor SG biopsies of patients with SS. Merged image shows several CD3+ T cell/miR-142-3p–coexpressing cells. White arrows point to miR-142-3p expressed by CD3+ T cells. Yellow arrows point to miR-142-3p expressed by epithelial cells. Cell nuclei were stained with DAPI (blue). Scale bar: 10 μm. (Representative images n = 4 SS patients.) (D) Fluorescence intensity quantification of miR-142-3p in T cells (CD3+) and non-T cells (CD3–) from minor SG biopsies of SS patients. (SS patients, n = 4.) (n = 12, median, maximum, and minimum shown.) Statistical significance was determined by Mann-Whitney nonparametric test; ***P < 0.001. (E) Expression of miR-142-3p in CD3+ T cells from PBMCs of healthy volunteers and SS patients (healthy volunteers, n = 4; SS patients, n = 4) (n = 4, median, maximum, and minimum shown). Statistical significance was determined by Mann-Whitney nonparametric test; **P < 0.01. (F) Expression of miR-142-3p in serum exosomes from healthy volunteers and SS patients (healthy volunteers, n = 4; SS patients, n = 4) (n = 4, median, maximum, and minimum shown). Statistical significance was determined by Mann-Whitney nonparametric test; *P < 0.05. The box plots depict the minimum and maximum values (whiskers), the upper and lower quartiles, and the median. The length of the box represents the interquartile range.

