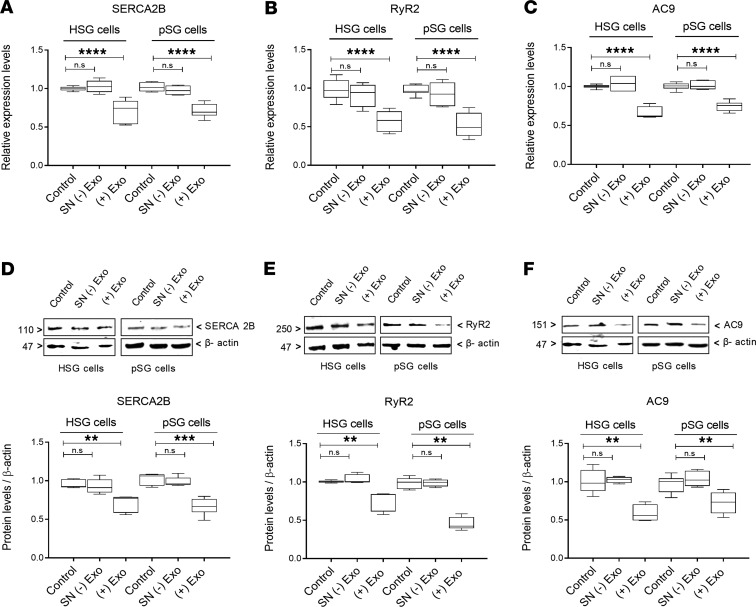
Figure 6. SERCA2B, RyR2, and AC9 expression in epithelial cells is altered by T cell exosomes.
(A–C) mRNA expression for SERCA2B, RyR2, and AC9 in HSG and pSG cells. (D–F) Representative Western blots and relative protein levels of SERCA2B, RyR2, and AC9 in HSG and pSG cells obtained by densitometric analysis. HSG and pSG cells were treated with complete epithelial cell medium (control), exosome-depleted supernatant [SN (-) Exo], or pure exosomes isolated from activated T cells [(+) Exo]. Figure 6, D and F, are derived from the same blots and thus share the same loading control. The box plots depict the minimum and maximum values (whiskers), the upper and lower quartiles, and the median. The length of the box represents the interquartile range. (n = 5, median, maximum, and minimum shown; **P < 0.01, ***P < 0.001, and ****P < 0.0001, determined by Mann-Whitney nonparametric test.) n.s, not significant.

