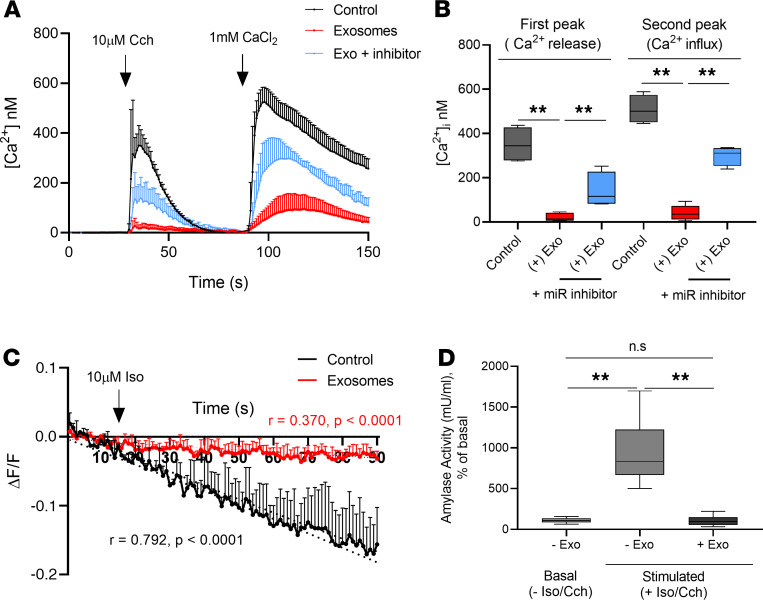
Figure 8. T cell–derived exosomes affect Ca2+ signaling, cAMP production, and amylase secretion in 3D cultures of HSG acini.
(A and B) Internal Ca2+ concentration was measured in 3D HSG acini. 3D HSG acini were treated with complete epithelial cell medium (black), exosomes isolated from activated T cells (red), or exosomes and miR-142-3p inhibitor (light blue). 3D HSG acini were loaded with Fluo-4-AM. Time course of [Ca2+]i induced by stimulation of 3D HSG acini with 10 μM Cch in the absence or presence of external CaCl2(A) and quantification of calcium release entry peaks (B) (n = 4, median, maximum, and minimum shown). Statistical significance was determined by Mann-Whitney nonparametric test; **P < 0.01. (There were 15 cells per condition, n = 4 experiments.) (C) Time course of cAMP production in cADDis cAMP biosensor–loaded 3D acini that were stimulated with Iso (10 μM). Linear regression analysis of cAMP production versus time in 3D acini control (black) and 3D acini treated with pure exosomes isolated from activated T cells (red). (There were 15 cells per condition, n = 3 experiments.) (D) Summary for the percentage of amylase activity with respect to basal condition under 10 μM Cch and 10 μM Iso stimulation (n = 6, median, maximum, and minimum shown). Statistical significance was determined by Mann-Whitney nonparametric test; **P < 0.01. The box plots depict the minimum and maximum values (whiskers), the upper and lower quartiles, and the median. The length of the box represents the interquartile range.

