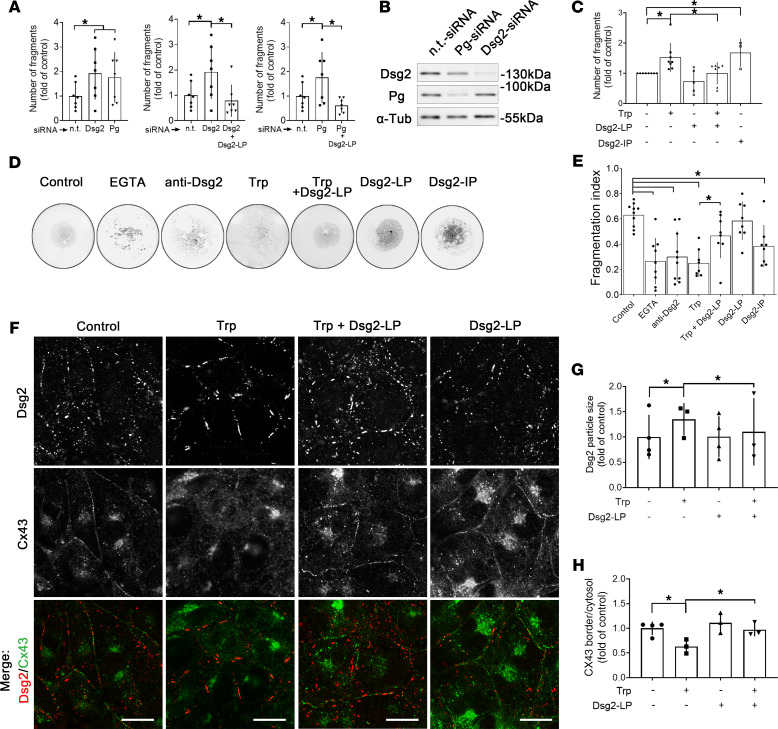
Figure 3. Disruption of intercellular junctions is rescued by stabilization of Dsg2 binding.
(A) Dissociation assays of HL-1 monolayer treated with Dsg2- or Pg-siRNA and additional Dsg2-LP treatment (n = 8). One-way ANOVA with Bonferroni’s post hoc test. (B) Western blot analysis for Dsg2 and Pg performed in parallel to dissociation assays to show successful protein reduction after Dsg2- or Pg-siRNA treatment. α-Tubulin (α-Tub) served as loading control (n = 8). (C) Dissociation assay of HL-1 cell monolayer after disruption of cell cohesion by Trp or Dsg2-IP with Dsg2-LP treatment (control n = 8; Trp n = 8; Trp + Dsg-LP n = 7; Dsg2-LP n = 5; Dsg2-IP n = 3). One-way ANOVA with Bonferroni’s post hoc test. (D) Representative images of bead fragmentation after application of mechanical stress. Adhesion assay of Dsg2-Fc–coated beads with same conditions as C. (E) Ca2+ chelator EGTA and anti-Dsg2 antibody served as negative controls (control n = 10; EGTA n = 9; anti-Dsg2 n = 10; Trp n = 8; Trp + Dsg-LP n = 8; Dsg2-LP n = 8; Dsg2-IP n = 8). One-way ANOVA with Bonferroni’s post hoc test. (F) Representative immunostaining of HL-1 cells stained for Dsg2 (red) and Cx43 (green) treated with Trp, Dsg2-LP, or a combination of both for 24 hours (n = 8); scale bar: 10 μm. (G) Quantitative analysis of single-Dsg2 particle size (>30 cells from 3–4 independent experiments). (H) Quantitative analysis of Cx43 staining as ratio of intensity of staining at cell-cell border versus cytosol (>30 cells from 3 independent experiments). *P < 0.05. One-way ANOVA with Tukey’s post hoc test.

