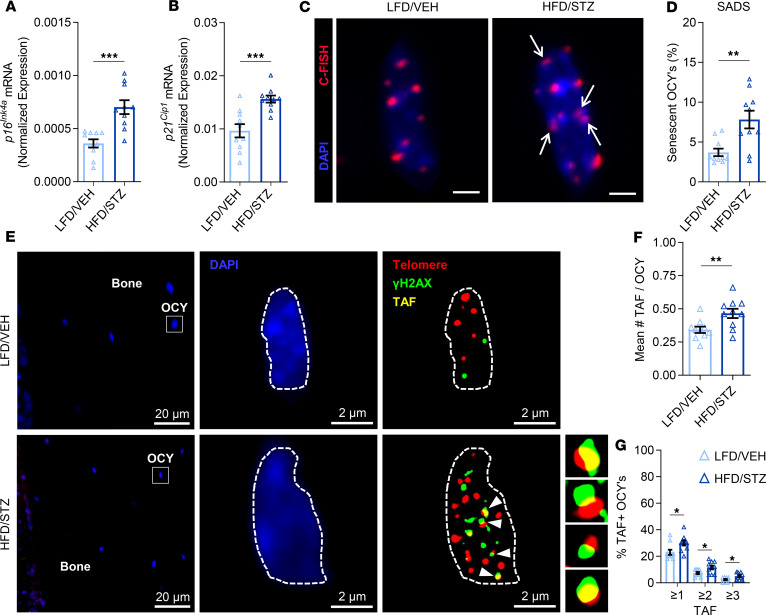
Figure 7. T2D is associated with accelerated osteocyte senescence in bone.
In vivo rt-qPCR mRNA gene expression analyses of (A) p16Ink4a (Cdkn2a) and (B) p21Cip1 (Cdkn1a) in osteocyte-enriched bone samples. (C) Representative images of a nonsenescent osteocyte in an LFD/VEH mouse (original magnification, ×100) versus a senescent osteocyte in an HFD/STZ mouse according to the senescence-associated distension of satellites (SADS, see white arrows) assay in cortical bone diaphysis sections (scale bars: 2 μm); 30 osteocytes were analyzed per mouse (n = 10/group). C-FISH, centromere-FISH. (D) Quantification of the percentage of senescent osteocytes in mice according to the SADS assay. (E) Representative images of bone and within a nonsenescent osteocyte in an LFD/VEH mouse (original magnification, ×63, oil) versus a senescent osteocyte in an HFD/STZ mouse according to the telomere-associated foci (TAF, see white arrows) assay in cortical bone diaphysis sections; 50 osteocytes were analyzed per mouse (n = 10/group). Quantification of (F) the mean number of TAF per osteocyte and (G) the mean percentage of TAF-positive osteocytes per mouse based on the following criteria: percentage of OCYs with ≥1 TAF, percentage of OCYs with ≥2 TAF, and percentage of OCYs with ≥3 TAF, respectively. Data represent mean ± SEM (error bars). *P < 0.05; **P < 0.01; ***P < 0.001 (independent samples t test or Wilcoxon’s rank-sum test, as appropriate). HFD, high-fat diet; STZ, streptozotocin; T2D, type 2 diabetes; LFD, low-fat diet; VEH, vehicle; OCY’s, osteocytes.

