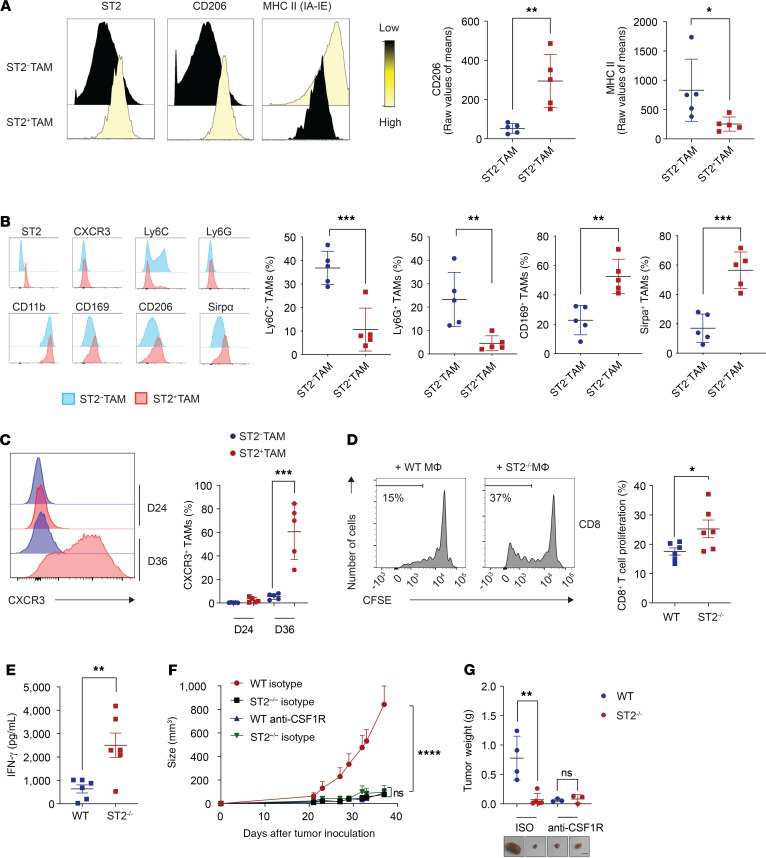
Figure 4. ST2+ TAM characterization.
(A) CyTOF analysis of M2 phenotype of ST2+ TAMs and ST2– TAMs from MC38 tumors. Representative CyTOF overlay histograms; and quantification (n = 5; data displayed as mean + SD). (B) Flow cytometry analysis of ST2+ TAMs and ST2– TAMs from MC38 tumors. Representative histogram overlays of ST2+ TAMs and ST2– TAMs for the indicated surface markers; and quantification (n = 5; data displayed as mean + SD). (C) Expression levels of CXCR3 on ST2+ TAMs during tumor development. Representative histogram of CXCR3 expression and quantification (n = 5; data displayed as mean + SD). (D) Macrophage suppression assay of MC38-enriched macrophages from WT and ST2–/– mice. Representative flow cytometry histograms of CD8+ T cell proliferation (CFSE) upon distinct coculture conditions; and quantification of CD8+ T cell proliferation upon TAM coculture (n = 6; data displayed as mean + SEM). (E) Quantification of T cell IFN-γ secretion on supernatants upon TAM coculture (n = 6; data displayed as mean + SEM). Growth (F) and weight (G) of MC38 tumors upon macrophage depletion using anti-CSF1R antibodies (WT isotype, n = 4; ST2–/– isotype, n = 5; WT anti-CSF1R, n = 6; ST2–/– anti-CSF1R, n = 6) (F, data displayed as mean + SEM; G, mean + SD) Scale bar: 1 cm. *P < 0.05, **P < 0.01, ***P < 0.001, ****P < 0.0001. Significance was determined by 2-tailed unpaired t test (A–E) and 2-way ANOVA (F).

