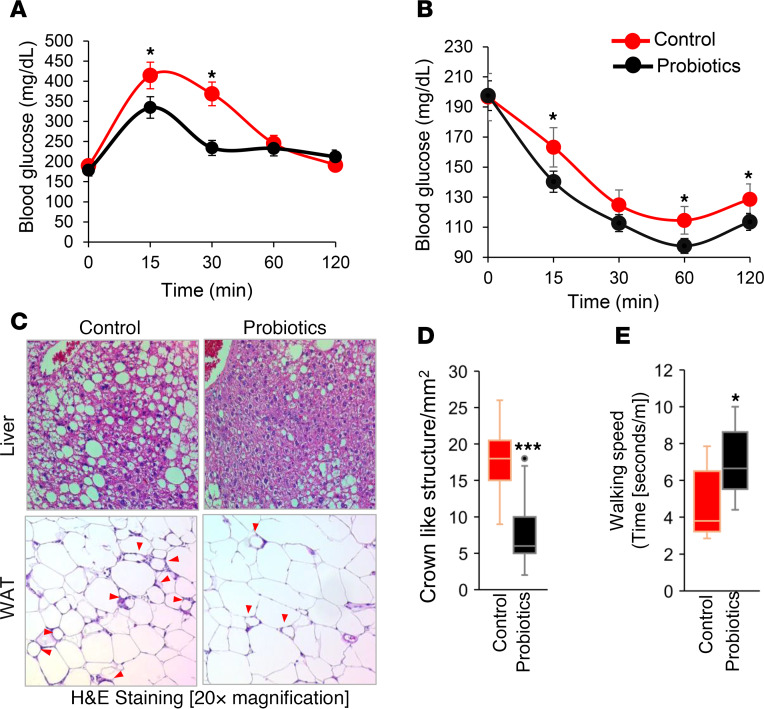
Figure 1. Probiotics feeding prevents HFD-induced metabolic dysfunctions in older mice.
(A and B) Ten weeks of probiotics improved glucose tolerance and enhanced insulin sensitivity in older obese mice, measured by oral glucose tolerance test (A) and insulin tolerance test (B) (n = 6 in control and n = 8 in probiotics groups; *P < 0.05, 2-way ANOVA). (C) Representative images of H&E staining of liver (upper panels) showing reduced fat accumulation and white adipose tissue (WAT; lower panels) showing reduced adipocyte size, along with reduced inflammation (indicated by crown-like structures; red arrows) in probiotics fed mice (n = 8) compared with their controls (n = 6). (D) Crown-like structures are graphed. (E) Probiotic-fed older obese mice (n = 8) exhibited higher physical function presented as walking speed compared with their age- and sex-matched HFD-fed controls (n = 6). Values are mean of n = 6–8 mice in each group, and data are shown as mean ± SEM. *P < 0.05, and ***P < 0.001 by 2-way ANOVA with Bonferroni’s correction (A and B) and Student’s t test (D and E).

